Peer Review and The NIPS Experiment
MLPM Summer School, Museum of Science and Industry, Manchester, UK
NeurIPS in Numbers
- To review papers we had:
- 1474 active reviewers (1133 in 2013)
- 92 area chairs (67 in 2013)
- 2 program chairs
NeurIPS in Numbers
- In 2014 NeurIPS had: 1678 submissions 414 accepted papers 20 oral presentations 62 spotlight presentations 331 poster presentations 19 papers rejected without review
The NeurIPS Experiment
- How consistent was the process of peer review?
- What would happen if you independently reran it?
The NeurIPS Experiment
- We selected ~10% of NeurIPS papers to be reviewed twice, independently.
- 170 papers were reviewed by two separate committees.
- Each committee was 1/2 the size of the full committee.
- Reviewers allocated at random
- Area Chairs allocated to ensure distribution of expertise
Notes on the Timeline for NeurIPS
AC recruitment (3 waves): * 17/02/2014 * 08/03/2014 * 09/04/2014
We requested names of reviewers from ACs in two waves: * 25/03/2014 * 11/04/2014
Reviewer recruitment (4 waves): * 14/04/2014 * 28/04/2014 * 09/05/2014 * 10/06/2014 (note this is after deadline … lots of area chairs asked for reviewers after the deadline!). We invited them en-masse.
- 06/06/2014 Submission Deadline
- 12/06/2014 Bidding Open For Area Chairs (this was delayed by CMT issues)
- 17/06/2014 Bidding Open For Reviewers
- 01/07/2014 Start Reviewing
- 21/07/2014 Reviewing deadline
- 04/08/2014 Reviews to Authors
- 11/08/2014 Author Rebuttal Due
- 25/08/2014 Teleconferences Begin
- 30/08/2014 Teleconferences End
- 1/09/2014 Preliminary Decisions Made
- 9/09/2014 Decisions Sent to Authors
Decision Making Timeline
Deadline 6th June
- three weeks for paper bidding and allocation
- three weeks for review
- two weeks for discussion and adding/augmenting reviews/reviewers
- one week for author rebuttal
- two weeks for discussion
- one week for teleconferences and final decisons
- one week cooling off
Decisions sent 9th September
Speculation
- To check public opinion before experiment: scicast question
NeurIPS Experiment Results
| Committee 1 | |||
| Accept | Reject | ||
| Committee 2 | Accept | 22 | 22 |
| Reject | 21 | 101 | |
4 papers rejected or withdrawn without review.
Summarizing the Table
- inconsistency: 43/166 = 0.259
- proportion of decisions that were not the same
- accept precision \(0.5 \times 22/44\) + \(0.5 \times 21/43\) = 0.495
- probability any accepted paper would be rejected in a rerunning
- reject precision = \(0.5\times 101/(22+101)\) + \(0.5\times 101/(21 + 101)\) = 0.175
- probability any rejected paper would be rejected in a rerunning
- agreed accept rate = 22/101 = 0.218
- ratio between aggreed accepted papers and agreed rejected papers.
Reaction After Experiment
Public reaction after experiment documented here
Open Data Science (see Heidelberg Meeting)
NIPS was run in a very open way. Code and blog posts all available!
Reaction triggered by this blog post.
A Random Committee @ 25%
| Committee 1 | |||
| Accept | Reject | ||
| Committee 2 | Accept | 10.4 (1 in 16) | 31.1 (3 in 16) |
| Reject | 31.1 (3 in 16) | 93.4 (9 in 16) | |
Stats for Random Committee
For random committee we expect: * inconsistency of 3 in 8 (37.5%) * accept precision of 1 in 4 (25%) * reject precision of 3 in 4 (75%) and a * agreed accept rate of 1 in 10 (10%).
Actual committee’s accept precision markedly better with 50% accept precision.
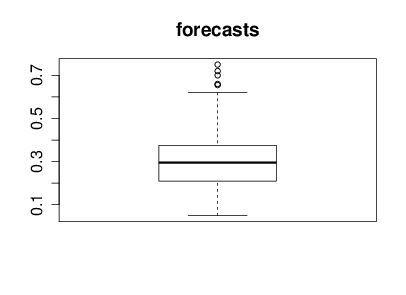
Uncertainty: Accept Rate
Uncertainty: Accept Precision
- How reliable is the consistent accept score?
Bayesian Analysis
- Multinomial distribution three outcomes.
- Uniform Dirichlet prior.
- (doesn’t account for implausability of ‘active inconsistency’)
Conclusion
- For parallel-universe NIPS we expect between 38% and 64% of the presented papers to be the same.
- For random-parallel-universe NIPS we only expect 25% of the papers to be the same.
Discussion
- Error types:
- type I error as accepting a paper which should be rejected.
- type II error rejecting a paper should be accepted.
- Controlling for error:
- many reviewer discussions can be summarised as subjective opinions about whether controlling for type I or type II is more important.
- with low accept rates, type I errors are much more common.
- Normally in such discussions we believe there is a clear underlying boundary.
- For conferences there is no clear separation points, there is a spectrum of paper quality.
- Should be explored alongside paper scores.
Thanks!
- twitter: @lawrennd
- podcast: The Talking Machines
- newspaper: Guardian Profile Page
- blog: http://inverseprobability.com