The Data Science Process
Neil D. Lawrence
AMLC Data Science Workshop Address
2017-04-18
Neil D. Lawrence
Amazon Research Cambridge and University of Sheffield
@lawrennd inverseprobability.com
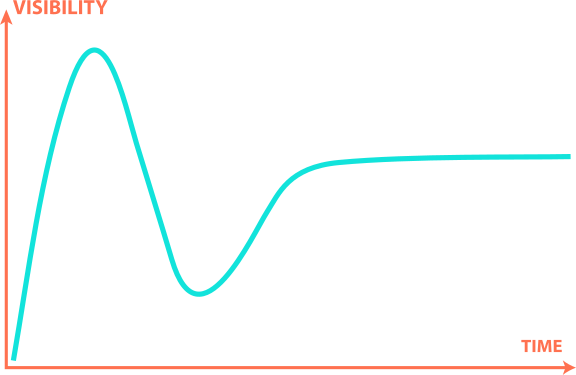
Gartner Hype Cycle

Machine Learning
\[ \text{data} + \text{model} \rightarrow \text{prediction}\]
Machine Learning
Normal ML (& stats?) focus: model
In real world need more focus on: data
motivation for data science
Background: Big Data
The pervasiveness of data brings forward particular challenges.
Emerging themes: Devolving compute onto device.
Data preprocessing: Internet of Intelligence.
“Embodiment Factors”

|

|
|
| compute | ~10 gigaflops | ~ 1000 teraflops? |
| communicate | ~1 gigbit/s | ~ 100 bit/s |
|
embodiment (compute/communicate) |
10 | ~ 1013 |
Evolved Relationship
Challenges
Paradoxes of the Data Society
Quantifying the Value of Data
Privacy, loss of control, marginalisation
Challenges
Paradoxes of the Data Society
Quantifying the Value of Data
Privacy, loss of control, marginalisationMachine Learning Systems Design
Breadth vs Depth Paradox
Able to quantify to a greater and greater degree the actions of individuals
But less able to characterize society
As we measure more, we understand less
What?
Perhaps greater preponderance of data is making society itself more complex
Therefore traditional approaches to measurement are failing
Curate’s egg of a society: it is only ‘measured in parts’
Wood or Tree
- Can either see a wood or a tree.

Examples
Election polls (UK 2015 elections, EU referendum, US 2016 elections)
Clinical trial and personalized medicine
Social media memes
Filter bubbles and echo chambers
The Maths
\[ \mathbf{Y} = \begin{bmatrix} y_{1, 1} & y_{1, 2} &\dots & y_{1,p}\\ y_{2, 1} & y_{2, 2} &\dots & y_{2,p}\\ \vdots & \vdots &\dots & \vdots\\ y_{n, 1} & y_{n, 2} &\dots & y_{n,p} \end{bmatrix} \in \Re^{n\times p} \]
The Maths
\[ \mathbf{Y} = \begin{bmatrix} \mathbf{y}^\top_{1, :} \\ \mathbf{y}^\top_{2, :} \\ \vdots \\ \mathbf{y}^\top_{n, :} \end{bmatrix} \in \Re^{n\times p} \]
The Maths
\[ \mathbf{Y} = \begin{bmatrix} \mathbf{y}_{:, 1} & \mathbf{y}_{:, 2} & \dots & \mathbf{y}_{:, p} \end{bmatrix} \in \Re^{n\times p} \]
The Maths
\[p(\mathbf{Y}|\boldsymbol{\theta}) = \prod_{i=1}^n p(\mathbf{y}_{i, :}|\boldsymbol{\theta})\]
The Maths
\[p(\mathbf{Y}|\boldsymbol{\theta}) = \prod_{i=1}^n p(\mathbf{y}_{i, :}|\boldsymbol{\theta})\]
\[\log p(\mathbf{Y}|\boldsymbol{\theta}) = \sum_{i=1}^n \log p(\mathbf{y}_{i, :}|\boldsymbol{\theta})\]
Consistency
Typically \(\boldsymbol{\theta} \in \Re^{\mathcal{O}(p)}\)
Consistency reliant on large sample approximation of KL divergence
\[ \text{KL}(P(\mathbf{Y})|| p(\mathbf{Y}|\boldsymbol{\theta}))\]
Minimization is equivalent to maximization of likelihood.
A foundation stone of classical statistics.
Large \(p\)
For large \(p\) the parameters are badly determined.
Large \(p\) small \(n\) problem.
Easily dealt with through definition.
The Maths
\[p(\mathbf{Y}|\boldsymbol{\theta}) = \prod_{j=1}^p p(\mathbf{y}_{:, j}|\boldsymbol{\theta})\]
\[\log p(\mathbf{Y}|\boldsymbol{\theta}) = \sum_{j=1}^p \log p(\mathbf{y}_{:, j}|\boldsymbol{\theta})\]
Breadth vs Depth
Modern Measurement deals with depth (many subjects) … or breadth lots of detail about subject.
- But what about
- \(p\approx n\)?
- Stratification of populations: batch effects etc.
Does \(p\) Even Exist?
Massively missing data.
Classical bias towards tables.
Streaming data.
Also need
- More classical statistics!
- Like the ‘paperless office’
A better characterization of human (see later)
- Larger studies (100,000 genome)
- Combined with complex models: algorithmic challenges
Quantifying the Value of Data
There’s a sea of data, but most of it is undrinkable

We require data-desalination before it can be consumed!
Data — Quotes from NIPS Workshop on ML for Healthcare
- 90% of our time is spent on validation and integration (Leo Anthony Celi)
- “The Dirty Work We Don’t Want to Think About” (Eric Xing)
- “Voodoo to get it decompressed” (Francisco Giminez)
- In health care clinicians collect the data and often control the direction of research through guardianship of data.
Quotes from Today
- Getting money from management for data collection and annotation can be a total nightmare.
Value
How do we measure value in the data economy?
How do we encourage data workers: curation and management
Incentivization for sharing and production.
Quantifying the value in the contribution of each actor.
Embodiment:
Data Readiness Levels (see also arxiv)
Three Bands of Data Readiness:
Band C - accessibility
Band B - validity
Band A - usability
Accessibility: Band C
- Hearsay data.
- Availability, is it actually being recorded?
- privacy or legal constraints on the accessibility of the recorded data, have ethical constraints been alleviated?
- Format: log books, PDF …
- limitations on access due to topology (e.g. it’s distributed across a number of devices)
- At the end of Band C data is ready to be loaded into analysis software (R, SPSS, Matlab, Python, Mathematica)
Validity: Band B
- faithfulness and representation
- visualisations.
- exploratory data analysis
- noise characterisation.
- Missing values.
- Example, was a column or columns accidentally perturbed (e.g. through a sort operation that missed one or more columns)? Or was a gene name accidentally converted to a date?
- At the end of Band B, ready to define a candidate question, the context, load into OpenML
Usability: Band A
- The usability of data
- Band A is about data in context.
- Consider appropriateness of a given data set to answer a particular question or to be subject to a particular analysis.
- At the end of Band A it’s ready for RAMP, Kaggle, define a task in OpenML.
Recursive Effects
Band A may also require
active collection of new data.
annotation of data by human experts (Enrica)
revisiting the collection (and running through the appropriate stages again)
Also …
Encourage greater interaction between application domains and data scientists
Encourage visualization of data
Incentivise the delivery of data.
Analogies: For SDEs describe data science as debugging.
See Also …
- Data Joel Tests
Internet of People
Fog computing: barrier between cloud and device blurring.
Stuxnet: Adversarial and Security implications for intelligent systems.
Complex feedback between algorithm and implementation
Deploying ML in Real World: Machine Learning Systems Design
Major new challenge for systems designers.
Internet of Intelligence but currently:
- AI systems are currently fragile
Fragility of AI Systems
They are componentwise built from ML Capabilities.
Each capability is independently constructed and verified.
- Pedestrian detection
Road line detection
Important for verification purposes.
Rapid Reimplementation
Whole systems are being deployed.
But they change their environment.
The experience evolved adversarial behaviour.
Machine Learning Systems Design

Turnaround And Update
There is a massive need for turn around and update
- A redeploy of the entire system.
- This involves changing the way we design and deploy.
Interface between security engineering and machine learning.
Conclusion
- Data science offers a great deal of promise.
- There are challenges and pitfalls
- It is incumbent on us to avoid them
Many solutions rely on education and awareness
- There are particular challenges around the Internet of Intelligence.
Thanks!
- twitter: @lawrennd
- blog: http://inverseprobability.com