Access, Assess and Address: A Pipeline for (Automated?) Data Science
Abstract
Data Science is an emerging discipline that is being promoted as a universal panacea for the world’s desire to make better informed decisions based on the wealth of data that is available in our modern interconnected society. In practice data science projects often find it difficult to deliver. In this talk we will review efforts to drive data informed in real world examples, e.g., the UK’s early Covid19 pandemic response. We will introduce a framework for categorising the stages and challenges of the data science pipeline and relate it to the challenges we see when giving data driven answers to real world questions. We will speculate on where automation may be able to help but emphasise that automation in this landscape is challenging when so many issues remain for getting humans to do the job well.
Lies and Damned Lies
There are three types of lies: lies, damned lies and statistics
Benjamin Disraeli 1804-1881
Benjamin Disraeli said1 that there three types of lies: lies, damned lies and statistics. Disraeli died in 1881, 30 years before the first academic department of applied statistics was founded at UCL. If Disraeli were alive today, it is likely that he’d rephrase his quote:
There are three types of lies, lies damned lies and big data.
Why? Because the challenges of understanding and interpreting big data today are similar to those that Disraeli faced in governing an empire through statistics in the latter part of the 19th century.
The quote lies, damned lies and statistics was credited to Benjamin Disraeli by Mark Twain in his autobiography. It characterizes the idea that statistic can be made to prove anything. But Disraeli died in 1881 and Mark Twain died in 1910. The important breakthrough in overcoming our tendency to overinterpet data came with the formalization of the field through the development of mathematical statistics.
Data has an elusive quality, it promises so much but can deliver little, it can mislead and misrepresent. To harness it, it must be tamed. In Disraeli’s time during the second half of the 19th century, numbers and data were being accumulated, the social sciences were being developed. There was a large scale collection of data for the purposes of government.
The modern ‘big data era’ is on the verge of delivering the same sense of frustration that Disraeli experienced, the early promise of big data as a panacea is evolving to demands for delivery. For me, personally, peak-hype coincided with an email I received inviting collaboration on a project to deploy “Big Data and Internet of Things in an Industry 4.0 environment.” Further questioning revealed that the actual project was optimization of the efficiency of a manufacturing production line, a far more tangible and realizable goal.
The antidote to this verbage is found in increasing awareness. When dealing with data the first trap to avoid is the games of buzzword bingo that we are wont to play. The first goal is to quantify what challenges can be addressed and what techniques are required. Behind the hype fundamentals are changing. The phenomenon is about the increasing access we have to data. The manner in which customers information is recorded and processes are codified and digitized with little overhead. Internet of things is about the increasing number of cheap sensors that can be easily interconnected through our modern network structures. But businesses are about making money, and these phenomena need to be recast in those terms before their value can be realized.
Mathematical Statistics
Karl Pearson (1857-1936), Ronald Fisher (1890-1962) and others considered the question of what conclusions can truly be drawn from data. Their mathematical studies act as a restraint on our tendency to over-interpret and see patterns where there are none. They introduced concepts such as randomized control trials that form a mainstay of the our decision making today, from government, to clinicians to large scale A/B testing that determines the nature of the web interfaces we interact with on social media and shopping.


Figure: Karl Pearson (1857-1936), one of the founders of Mathematical Statistics.
Their movement did the most to put statistics to rights, to eradicate the ‘damned lies.’ It was known as ‘mathematical statistics’. Today I believe we should look to the emerging field of data science to provide the same role. Data science is an amalgam of statistics, data mining, computer systems, databases, computation, machine learning and artificial intelligence. Spread across these fields are the tools we need to realize data’s potential. For many businesses this might be thought of as the challenge of ‘converting bits into atoms.’ Bits: the data stored on computer, atoms: the physical manifestation of what we do; the transfer of goods, the delivery of service. From fungible to tangible. When solving a challenge through data there are a series of obstacles that need to be addressed.
Firstly, data awareness: what data you have and where its stored. Sometimes this includes changing your conception of what data is and how it can be obtained. From automated production lines to apps on employee smart phones. Often data is locked away: manual log books, confidential data, personal data. For increasing awareness an internal audit can help. The website data.gov.uk hosts data made available by the UK government. To create this website the government’s departments went through an audit of what data they each hold and what data they could make available. Similarly, within private buisnesses this type of audit could be useful for understanding their internal digital landscape: after all the key to any successful campaign is a good map.
Secondly, availability. How well are the data sources interconnected? How well curated are they? The curse of Disraeli was associated with unreliable data and unreliable statistics. The misrepresentations this leads to are worse than the absence of data as they give a false sense of confidence to decision making. Understanding how to avoid these pitfalls involves an improved sense of data and its value, one that needs to permeate the organization.
The final challenge is analysis, the accumulation of the necessary expertise to digest what the data tells us. Data requires intepretation, and interpretation requires experience. Analysis is providing a bottleneck due to a skill shortage, a skill shortage made more acute by the fact that, ideally, analysis should be carried out by individuals not only skilled in data science but also equipped with the domain knowledge to understand the implications in a given application, and to see opportunities for improvements in efficiency.
‘Mathematical Data Science’
As a term ‘big data’ promises much and delivers little, to get true value from data, it needs to be curated and evaluated. The three stages of awareness, availability and analysis provide a broad framework through which organizations should be assessing the potential in the data they hold. Hand waving about big data solutions will not do, it will only lead to self-deception. The castles we build on our data landscapes must be based on firm foundations, process and scientific analysis. If we do things right, those are the foundations that will be provided by the new field of data science.
Today the statement “There are three types of lies: lies, damned lies and ‘big data’” may be more apt. We are revisiting many of the mistakes made in interpreting data from the 19th century. Big data is laid down by happenstance, rather than actively collected with a particular question in mind. That means it needs to be treated with care when conclusions are being drawn. For data science to succede it needs the same form of rigour that Pearson and Fisher brought to statistics, a “mathematical data science” is needed.
You can also check my blog post on Lies, Damned Lies and Big Data.
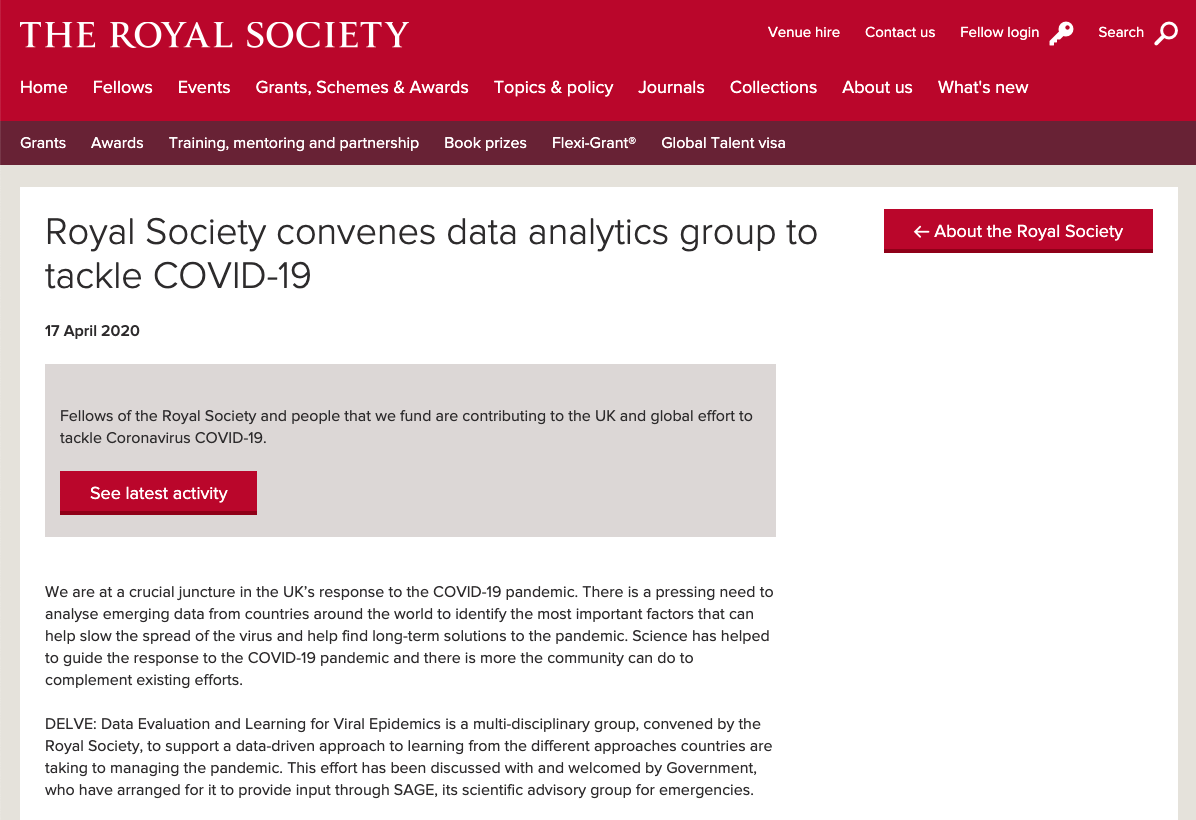
Figure: The Royal Society announces the DELVE group to tackle the COVID-19 crisis. https://royalsociety.org/news/2020/04/royal-society-convenes-data-analytics-group-to-tackle-COVID-19/.
DELVE Overview
The DELVE Initiative was convened by the Royal Society early in the pandemic in response for a perceived need to increase provide policy advice for the UK’s response to covide, with an initial focus on exit strategy from the first lock down.
Figure: The Royal Society announces the DELVE group to tackle the COVID-19 crisis. https://royalsociety.org/news/2020/04/royal-society-convenes-data-analytics-group-to-tackle-COVID-19/.
DELVE will contribute data driven analysis to complement the evidence base informing the UK’s strategic response, by:
- Analysing national and international data to determine the effect of different measures and strategies on a range of public health, social and economic outcomes
- Using emerging sources of data as new evidence from the unfolding pandemic comes to light
- Ensuring that the work of this group is coordinated with others and communicated as necessary both nationally and internationally
Delve Timeline
- First contact 3rd April
- First meeting 7th April
- First working group 16th April
The Delve initiative is a group that was convened by the Royal Society to help provide data-driven insights about the pandemic, with an initial focus on exiting the first lockdown and particular interest in using the variation of strategies across different international governments to inform policy.
Right from the start, data was at the heart of what DELVE does, but the reality is that little can be done without domain expertise and often the data we required wasn’t available.
However, even when it is not present, the notion of what data might be needed can also have a convening effect, bringing together multiple disciplines around the policy questons at hand. The Delve Data Readiness report (The DELVE Initiative, 2020a) makes recommendations for how we can improve our processes around data, but this talk also focuses on how data brings different disciplines together around data.
Any policy question can be framed in a number of different ways - what are the health outcomes; what is the impact on NHS capacity; how are different groups affected; what is the economic impact – and each has different types of evidence associated with it. Complex and uncertain challenges require efforts to draw insights together from across disciplines.
Sustained engagement between government and academia plays an important role in building mutual understanding about what each can deliver. Core to DELVE’s work was the intention that research questions be framed in ways that would resonate with the policy challenges being seen in government.
What is Machine Learning?
\[ \text{data} + \text{model} \stackrel{\text{compute}}{\rightarrow} \text{prediction}\]
The Big Data Paradox
The big data paradox is the modern phenomenon of “as we collect more data, we understand less.” It is emerging in several domains, political polling, characterization of patients for trials data, monitoring twitter for political sentiment.
I like to think of the phenomenon as relating to the notion of “can’t see the wood for the trees.” Classical statistics, with randomized controlled trials, improved society’s understanding of data. It improved our ability to monitor the forest, to consider population health, voting patterns etc. It is critically dependent on active approaches to data collection that deal with confounders. This data collection can be very expensive.
In business today, it is still the gold standard, A/B tests are used to understand the effect of an intervention on revenue or customer capture or supply chain costs.

Figure: New beech leaves growing in the Gribskov Forest in the northern part of Sealand, Denmark. Photo from wikimedia commons by Malene Thyssen, http://commons.wikimedia.org/wiki/User:Malene.
The new phenomenon is happenstance data. Data that is not actively collected with a question in mind. As a result, it can mislead us. For example, if we assume the politics of active users of twitter is reflective of the wider population’s politics, then we may be misled.
However, this happenstance data often allows us to characterise a particular individual to a high degree of accuracy. Classical statistics was all about the forest, but big data can often become about the individual tree. As a result we are misled about the situation.
The phenomenon is more dangerous, because our perception is that we are characterizing the wider scenario with ever increasing accuracy. Whereas we are just becoming distracted by detail that may or may not be pertinent to the wider situation.
This is related to our limited bandwidth as humans, and the ease with which we are distracted by detail. The data-inattention-cognitive-bias.
Big Model Paradox
The big data paradox has a sister: the big model paradox. As we build more and more complex models, we start believing that we have a high-fidelity representation of reality. But the complexity of reality is way beyond our feeble imaginings. So we end up with a highly complex model, but one that falls well short in terms of reflecting reality. The complexity of the model means that it moves beyond our understanding.
Increasing Need for Human Judgment
Figure: Diane Coyle’s Fitzwilliam Lecture where she emphasises as data increases, human judgment is more needed.
The domain of human judgment is increasing.
How these firms use knowledge. How do they generate ideas?
Data as a Convener
To improve communication, we need to ‘externalise cognition’: have objects that are outside our brains, are persistent in the real world, that we can combine with our individual knowledge. Doing otherwise leaves us imagining the world as our personal domain-utopias, ignoring the ugly realities of the way things actual progress.
Data can provide an excellent convener, because even if it doesn’t exist it allows conversations to occur about what data should or could exist and how it might allow us to address the questions of importance.
Models, while also of great potential value in externalising cognition, can be two complex to have conversations about and they can entrench beliefs, triggering model induced blindness (a variation on Kahneman’s theory induced blindness (Kahneman, 2011)).
Figure: Models can also be used to externalise cognition, but if the model is highly complex it’s difficult for two individuals to understand each others’ models. This shuts down conversation, often “mathematical intimidation” is used to shut down a line of questioning. This is highly destructive of the necessary cognitive diversity.
Bandwidth constraints on individuals mean that they tend to focus on their own specialism. This can be particularly problematic for those on the more theoretical side, because mathematical models are complex, and require a lot of deep thought. However, when communicating with others, unless they have the same in depth experience of mathematical modelling as the theoreticians, the models do not bring about good information coherehnce. Indeed, many computational models themselves are so complex now that no individual can understand the model whole.
Figure: Data can be queried, but the simplest query, what data do we need? Doesn’t even require the data to exist. It seems data can be highly effective for convening a multidisciplinary conversation.
Fritz Heider referred to happenings that are “psychologically represented in each of the participants” (Heider, 1958) as a preqequisite for conversation. Data is a route to that psychological representation.
Note: my introduction to Fritz Heider was through a talk by Nick Chater in 2010, you can read Nick’s thoughts on these issues in his book, The Mind is Flat (Chater, 2019).
Delve
Delve Reports
- Facemasks 4th May 2020 (The DELVE Initiative, 2020b)
- Test, Trace, Isolate 27th May 2020 (The DELVE Initiative, 2020c)
- Nosocomial Infections 6th July 2020 (The DELVE Initiative, 2020d)
- Schools 24th July 2020 (The DELVE Initiative, 2020e)
- Economics 14th August 2020 (The DELVE Initiative, 2020f)
- Vaccines 1st October 2020 (The DELVE Initiative, 2020g)
- Data 24th November 2020 (The DELVE Initiative, 2020a)
There is lots of hope for the role data science and AI could play, but we’re still a way off from being AI-ready. Further attention is needed on some of the foundational issues around data use – access, skills, culture – before we can begin to talk in earnest about deploying AI. [link here to data readiness]
Delve Data Report
The DELVE Initiative was established with the ambition that data science could play a role in helping develop policy responses to the COVID-19 pandemic, by identifying lessons from the responses of other countries or by combining datasets to generate novel insights. Such analysis requires access to data, which could come from both official statistics, or from so-called happenstance data, generated as a by-product of daily activities. Drawing from a multidisciplinary team of domain experts in policy, public health, economics, education, immunology, epidemiology, and social science, alongside statisticians, mathematicians, computer scientists and machine learning scientists, DELVE set out to provide advice and analysis that could feed into live policy decisions.
Our report focusses on what more we can do to ensure that this data is readily available (The DELVE Initiative, 2020a).
Delve Data Report: Recommendations
Government should update the statutory objective of the Office for National Statistics (ONS) to accommodate trustworthy access to happenstance data to generate national and local statistics. Such statistics are required on very short time frames to facilitate fast decision-making for the nation in the rapidly evolving circumstances of a national emergency.
The ONS should collaborate closely with the Information Commissioner’s Office (ICO) to formulate a standardized qualification for data access, equivalent to a ‘data driving license’ that would demonstrate trustworthiness and ensure that qualified experts can get rapid access to different data types with the appropriate standardized ethical and legal training in place.
Government should fund interdisciplinary pathfinder data projects. These projects should require collaborations between industries, run across government departments and integrate different academic expertise. Each project should target a specific policy question. Beyond the pathfinder role, the projects will leave a legacy in the form of expertise and guidance in understanding the stages of the data-sharing pipeline. Priority areas for pathfinder projects include:
Nowcasting of economic metrics: At least one of these pathfinder projects should create a close collaboration between Cabinet Office and Treasury around nowcasting of classical economic metrics (such as GDP) from happenstance data (e.g. payments data). Efficient resourcing and strategic implementation of data sharing projects will only be possible if Treasury and Cabinet Office are aligned on plausible benefits and costs of data sharing projects.
Mobility data: Another project should drive a step-change in the use of mobility data for public policy. To achieve this, the ONS should act as the trusted body to convert happenstance data into high-frequency population mobility statistics. One pathfinder project should produce daily views of population mobility between geographic regions, aggregated from origin to destination counts from mobile phone operators.
Delivering a rapid response requires the ability to quickly convene teams from across disciplines (and often institutions) around a key question. To facilitate this, we also used ideas from blog post on open data science. to facilitate communication and understanding.
The Three Esses Framework
Here we present a framework for thinking about data science that has three words that are meant to highlight three distinct types of data science activity that occur within a data science project: we call them access, assess and address.
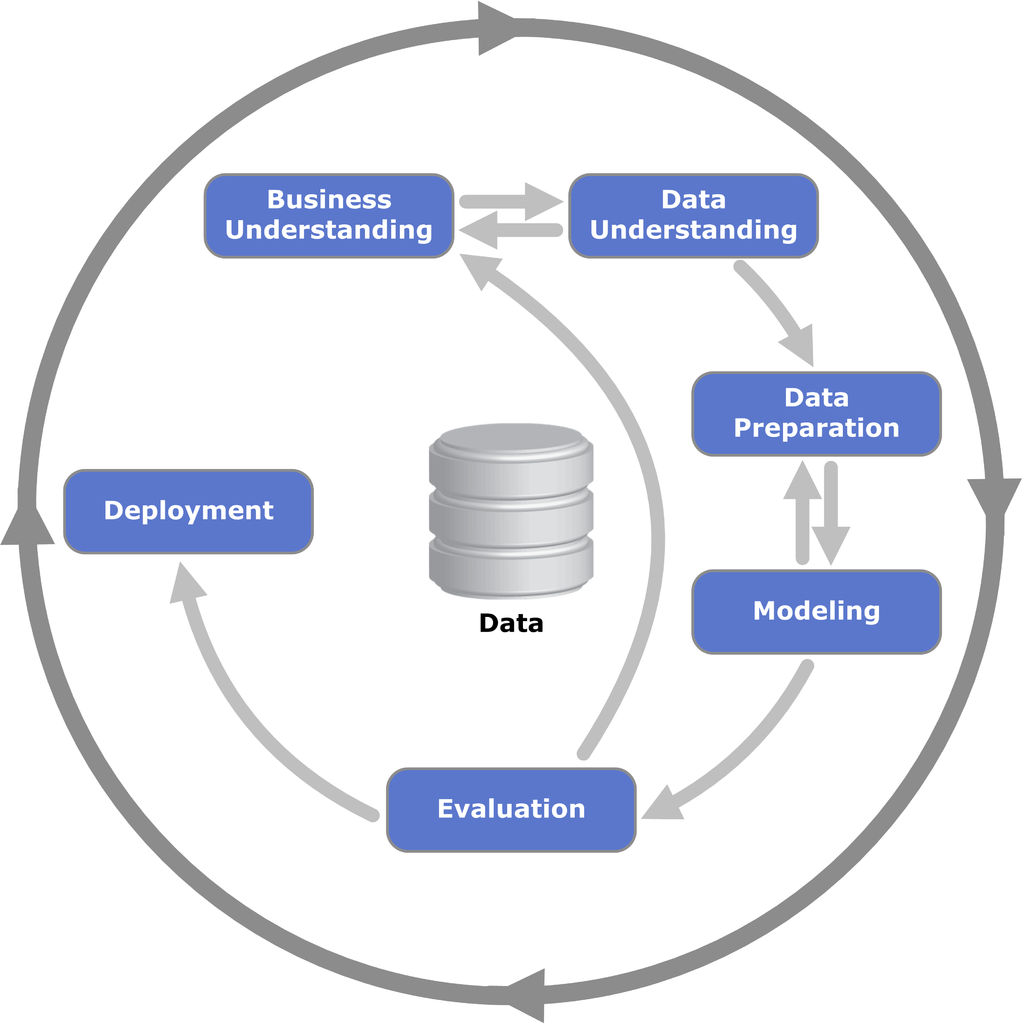
Figure: The CRISP Data Mining Process diagram.
There are formal processes designed for, e.g., data mining, but they are not always appropriate for operational science or continuous deployment. One is the CRISP-DM Chapman et al. (2000) process, which does a nice job of capturing the cyclic nature of these processes, but fails to capture the need to build resources that answer questions in real time that occurs in operational science and continuous deployment.
A more modern view from the O’Reilly book Doing Data Science frames the problem as shown in Figure
More generally, a data scientist is someone who knows how to extract meaning from and interpret data, which requires both tools and methods from statistics and machine learning, as well as being human. She spends a lot of time in the process of collecting, cleaning, and munging data, because data is never clean. This process requires persistence, statistics, and software engineering skills—skills that are also necessary for understanding biases in the data, and for debugging logging output from code.
Cathy O’Neil and Rachel Strutt
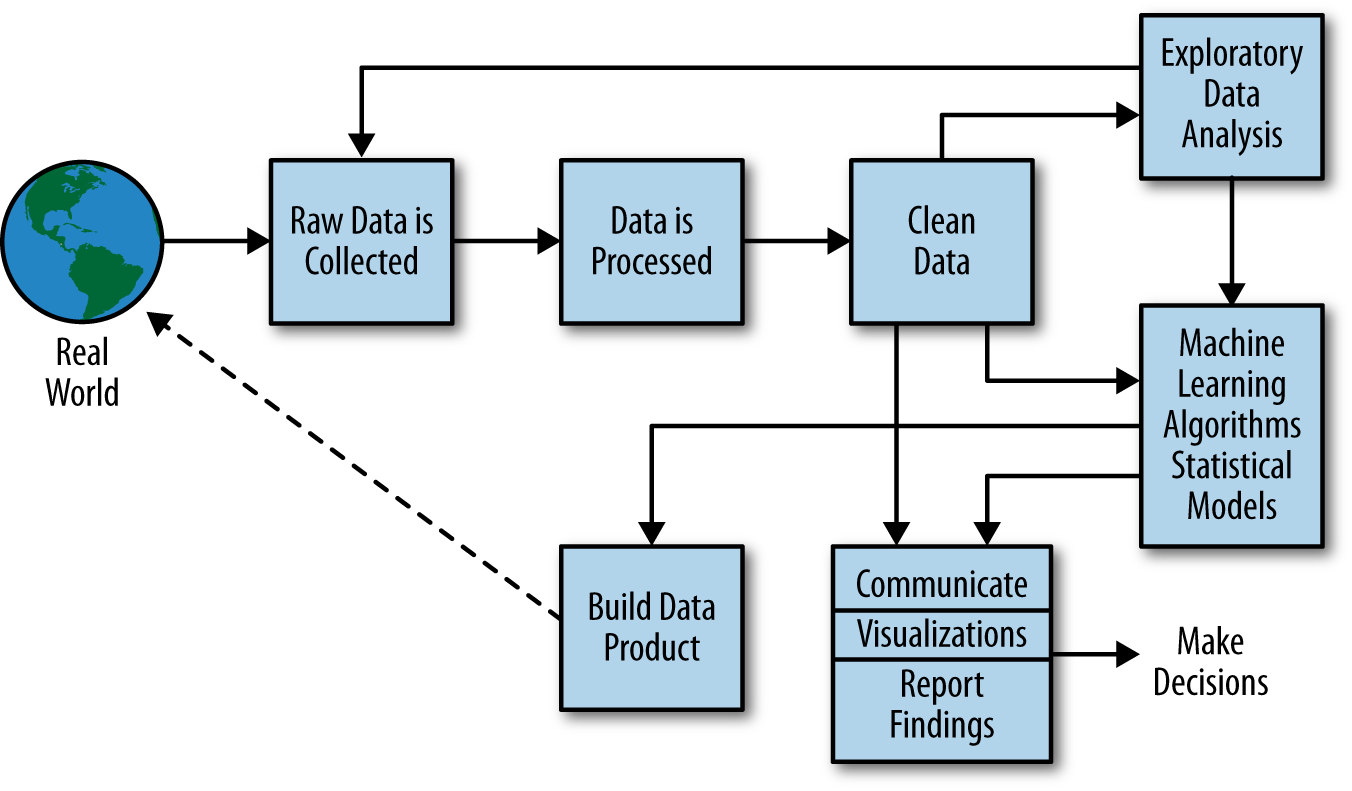
Figure: Another perspective on the data science process, this one from O’Neil and Schutt (2013).
One thing about working in an industrial environment, is the way that short-term thinking actions become important. For example, in Formula One, the teams are working on a two-week cycle to digest information from the previous week’s race and incorporate updates to the car or their strategy.
However, businesses must also think about more medium-term horizons. For example, in Formula 1 you need to worry about next year’s car. So while you’re working on updating this year’s car, you also need to think about what will happen for next year and prioritize these conflicting needs appropriately.
In the Amazon supply chain, there are the equivalent demands. If we accept that an artificial intelligence is just an automated decision-making system. And if we measure in terms of money automatically spent, or goods automatically moved, then Amazon’s buying system is perhaps the world’s largest AI.
Those decisions are being made on short time schedules; purchases are made by the system on weekly cycles. But just as in Formula 1, there is also a need to think about what needs to be done next month, next quarter and next year. Planning meetings are held not only on a weekly basis (known as weekly business reviews), but monthly, quarterly, and then yearly meetings for planning spends and investments.
Amazon is known for being longer term thinking than many companies, and a lot of this is coming from the CEO. One quote from Jeff Bezos that stuck with me was the following.
“I very frequently get the question: ‘What’s going to change in the next 10 years?’ And that is a very interesting question; it’s a very common one. I almost never get the question: ‘What’s not going to change in the next 10 years?’ And I submit to you that that second question is actually the more important of the two – because you can build a business strategy around the things that are stable in time. … [I]n our retail business, we know that customers want low prices, and I know that’s going to be true 10 years from now. They want fast delivery; they want vast selection. It’s impossible to imagine a future 10 years from now where a customer comes up and says, ‘Jeff I love Amazon; I just wish the prices were a little higher,’ [or] ‘I love Amazon; I just wish you’d deliver a little more slowly.’ Impossible. And so the effort we put into those things, spinning those things up, we know the energy we put into it today will still be paying off dividends for our customers 10 years from now. When you have something that you know is true, even over the long term, you can afford to put a lot of energy into it.”
This quote is incredibly important for long term thinking. Indeed, it’s a failure of many of our simulations that they focus on what is going to happen, not what will not happen. In Amazon, this meant that there was constant focus on these three areas, keeping costs low, making delivery fast and improving selection. For example, shortly before I left Amazon moved its entire US network from two-day delivery to one-day delivery. This involves changing the way the entire buying system operates. Or, more recently, the company has had to radically change the portfolio of products it buys in the face of Covid19.
Figure: Experiment, analyze and design is a flywheel of knowledge that is the dual of the model, data and compute. By running through this spiral, we refine our hypothesis/model and develop new experiments which can be analyzed to further refine our hypothesis.
From the perspective of the team that we had in the supply chain, we looked at what we most needed to focus on. Amazon moves very quickly, but we could also take a leaf out of Jeff’s book, and instead of worrying about what was going to change, remember what wasn’t going to change.
We don’t know what science we’ll want to do in five years’ time, but we won’t want slower experiments, we won’t want more expensive experiments and we won’t want a narrower selection of experiments.
As a result, our focus was on how to speed up the process of experiments, increase the diversity of experiments that we can do, and keep the experiments price as low as possible.
The faster the innovation flywheel can be iterated, then the quicker we can ask about different parts of the supply chain, and the better we can tailor systems to answering those questions.
We need faster, cheaper and more diverse experiments which implies we need better ecosystems for experimentation. This has led us to focus on the software frameworks we’re using to develop machine learning systems including data oriented architectures (Borchert (2020);(Lawrence-doa19?);Vorhemus and Schikuta (2017);Joshi (2007)), data maturity assessments (Lawrence et al. (2020)) and data readiness levels (See this blog post on Data Readiness Levels. and Lawrence (2017);The DELVE Initiative (2020a))
One challenge for data science and data science processes is that they do not always accommodate the real-time and evolving nature of data science advice as required, for example in pandemic response or in managing an international supply chain.
One possible starting point is to look at the software architectures that are used in large scale decision making systems, and understand what it is that they are bring to help solve these problems.
Figure: Data science processes do not always accommodate the real-time and evolving nature of data science advice as required, for example, for policy advice as described in this presentation.
Ride Sharing: Service Oriented to Data Oriented
The modern approach to software systems design is known as a service-oriented architectures (SOA). The idea is that software engineers are responsible for the availability and reliability of the API that accesses the service they own. Quality of service is maintained by rigorous standards around testing of software systems.
In data driven decision-making systems, the quality of decision-making is determined by the quality of the data. We need to extend the notion of service-oriented architecture to data-oriented architecture (DOA).
The focus in SOA is eliminating hard failures. Hard failures can occur due to bugs or systems overload. This notion needs to be extended in ML systems to capture soft failures associated with declining data quality, incorrect modeling assumptions and inappropriate re-deployments of models. We need to focus on data quality assessments. In data-oriented architectures engineering teams are responsible for the quality of their output data streams in addition to the availability of the service they support (Lawrence:drl17?). Quality here is not just accuracy, but fairness and explainability. This important cultural change would be capable of addressing both the challenge of technical debt (Sculley et al., 2015) and the social responsibility of ML systems.
Software development proceeds with a test-oriented culture. One where tests are written before software, and software is not incorporated in the wider system until all tests pass. We must apply the same standards of care to our ML systems, although for ML we need statistical tests for quality, fairness and consistency within the environment. Fortunately, the main burden of this testing need not fall to the engineers themselves: through leveraging classical statistics and emulation we will automate the creation and redeployment of these tests across the software ecosystem, we call this ML hypervision (WP5 ).
Modern AI can be based on ML models with many millions of parameters, trained on very large data sets. In ML, strong emphasis is placed on predictive accuracy whereas sister-fields such as statistics have a strong emphasis on interpretability. ML models are said to be ‘black boxes’ which make decisions that are not explainable.2
For the ride sharing system, we start to see a common issue with a more complex algorithmic decision-making system. Several decisions are being made multilple times. Let’s look at the decisions we need along with some design criteria.
- Driver Availability: Estimate time to arrival for Anne’s ride using Anne’s location and local available car locations. Latency 50 milliseconds
- Cost Estimate: Estimate cost for journey using Anne’s destination, location and local available car current destinations and availability. Latency 50 milliseconds
- Driver Allocation: Allocate car to minimize transport cost to destination. Latency 2 seconds.
So we need:
- a hypothetical to estimate availability. It is constrained by lacking destination information and a low latency requirement.
- a hypothetical to estimate cost. It is constrained by low latency requirement and
Simultaneously, drivers in this data ecosystem have an app which notifies them about new jobs and recommends them where to go.
Further advantages. Strategies for data retention (when to snapshot) can be set globally.
A few decisions need to be made in this system. First of all, when the user opens the app, the estimate of the time to the nearest ride may need to be computed quickly, to avoid latency in the service.
This may require a quick estimate of the ride availability.
The “Access, Assess, Address” paradigm is inspired by experience in operational data science both in the Amazon supply chain and in dealing with the UK pCovid-19 pandemic.
Figure: The challenges of operational data science are closer to the challenges of deploying software and machine learning solutions than a classical analysis. The AutoAI project at Cambridge is focussed on maintaining and explaining AI solutions.
Arguably the challenges for automated data science and deploying complex machine learning solutions are similar. The AutoAI project at Cambridge is focussed on maintaining and explaining machine learning systems. The assumption is that such systems are generally made up of interacting components that make decisions in a composite manner. They have interfaces to the real world where that data is collected, but they also generate data within themselelves. The challenge of collecting data is sometimes less the challenge of pacing the streets and more the challenge of extracting it from existing systems.
Access
In the Access, Assess, Address paradigm, the first challenge is accessing the data. Depending on domain, the skills needed to address this challenge will vary greatly. For example, Michael T. Smith was leading a project in collaboration with the Kampala police force to collate accident data.
Crash Map Kampala
The Crash Map Kampala project is a good example of a data science project where a major challenge was access.
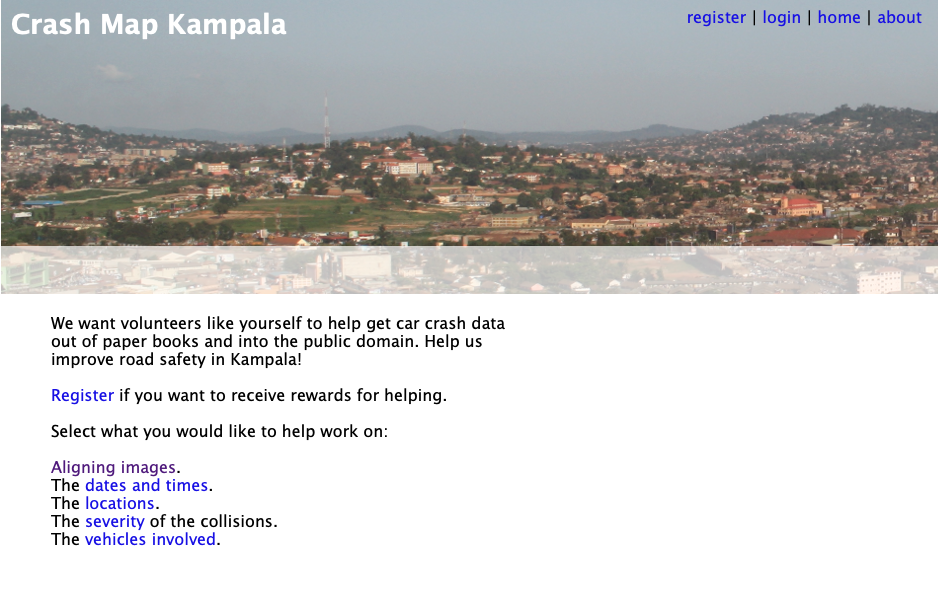
Figure: Crash Map Kampala was an initiative by Michael T. Smith and Bagonza Jimmy Owa Kinyonyi to map the location, date and severity of vehicle accidents across the city of Kampala. Original storage location for the data was in police log books.
The project is work from Bagonza Jimmy Owa Kinyony when he was an MSc student and Michael T. Smith when he was based at Makerere University AI-LAB.
The project was inspired by the observation that road traffic accidents are a leading cause of death for the young in many contexts, but the scale of the cause is difficult to compare directly because the number of deaths and serious injuries are difficult to access.
In Kampala this data is stored in log books at local police stations. Jimmy was in the Kampala police at the time, so the project focus was transcribing this information into a digital format where it could be mapped.
Due to the scale of the task, the approach of crowd sourcing the work was considered. This approach was also what launched the AI revolution through the ImageNet challenge, where data was labelled through Mechanical Turk (Russakovsky et al. (2015)).
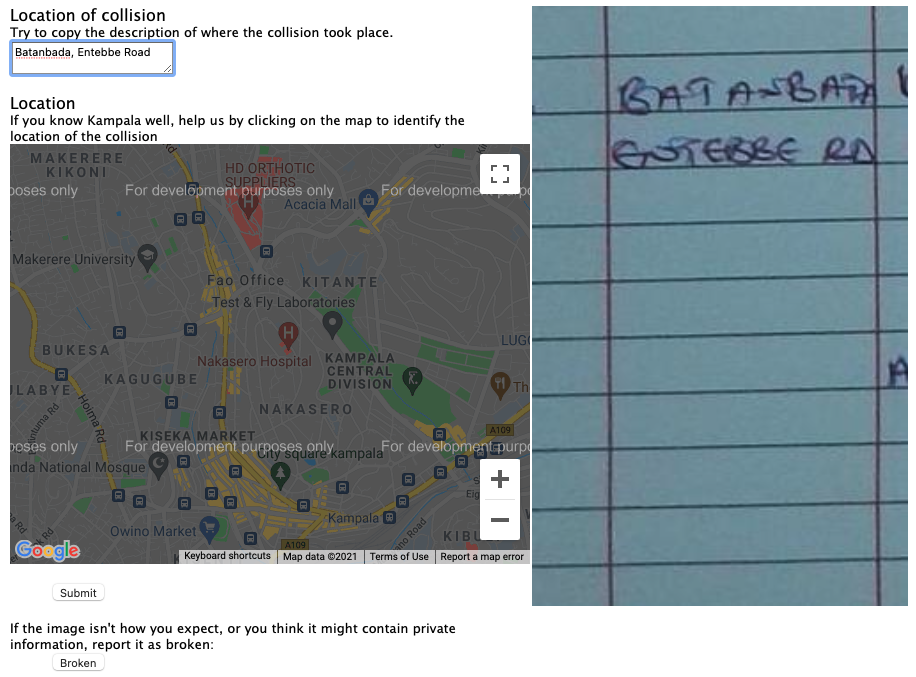
Figure:
But there are additional challenges with this data. The log books are typically accessed only by members of Kampala’s police force, in their recording of the accidents. So, permission from the police force was important. Additionally, personal information about those involved in the accidents might have been revealed in the process of crowdsourcing the work.
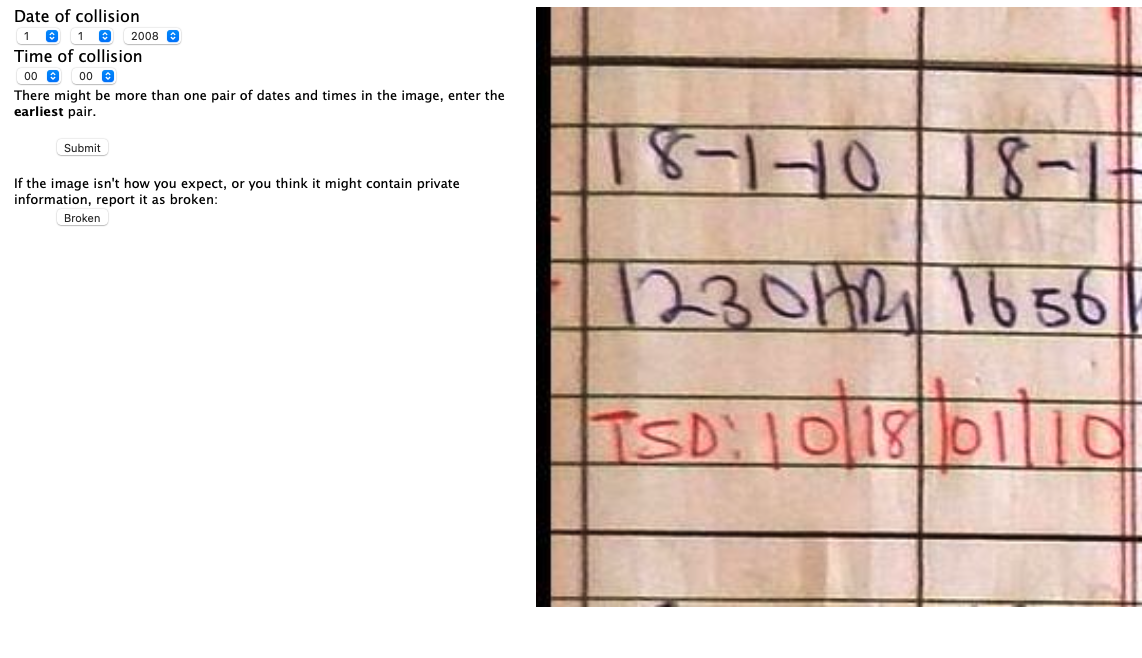
Figure: Alongside the location, the date and time of the crash gives more information that can be used to map crashes over time.
Much of the work here was therefore in the access of the data. Photographing the log books, obtaining legal permission from the Kampala police, ensuring that personal information was unlikely to be divulged.
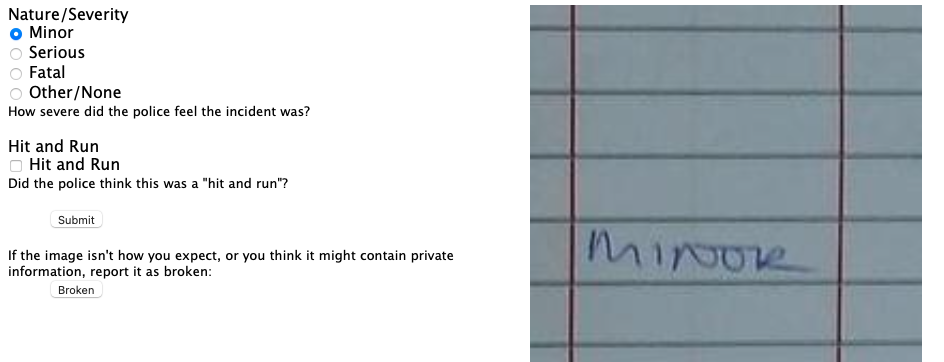
Figure: The severity of the crash is helpful in understanding how people are being affected by road accidents.
As well as software design and build, the work has legal and ethical issues. An important aspect in gaining progress was that Jimmy worked for the Kampala police. Indeed, the work eventually stalled when Jimmy was moved to a differen police location.
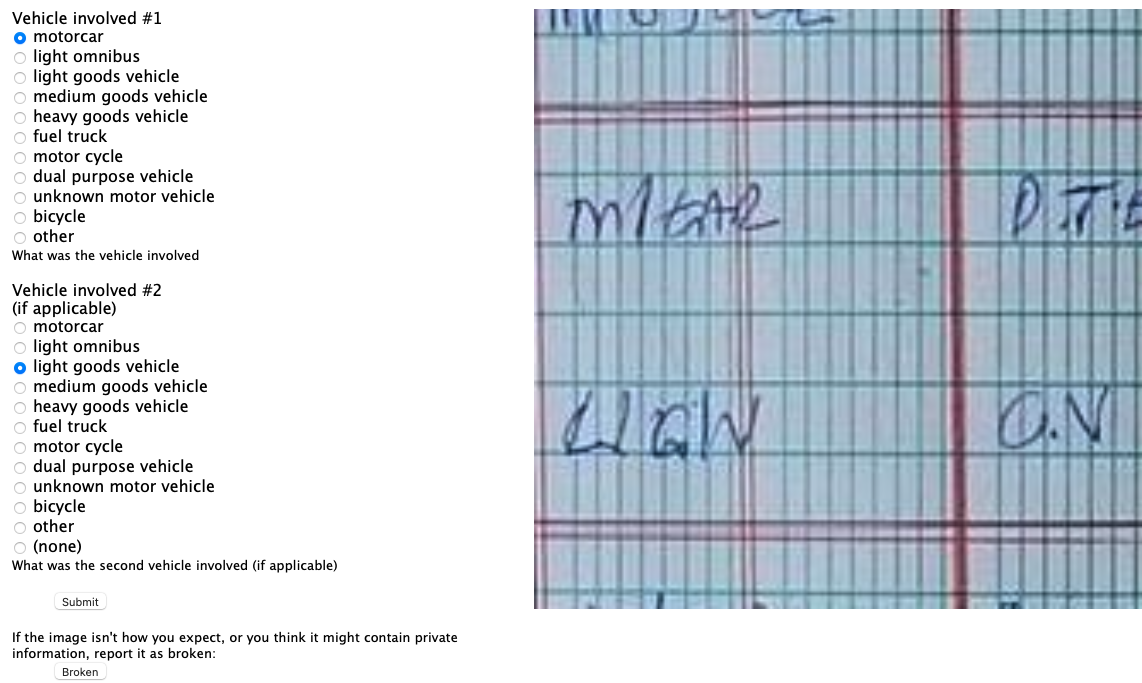
Figure: Understanding which vehicles are involved in accidents could also help with interventions that may be necessary.
The possiblity of leaking personal information was reduced, by presenting only a portion of each log book page to users for analysis. So we can see in Figure the interface for obtainin the location from the log book. But the the date and time (Figure ) the severity of the accident (Figure ) and the vehicles involved (Figure ) are all dealt with in separate parts of the interface.
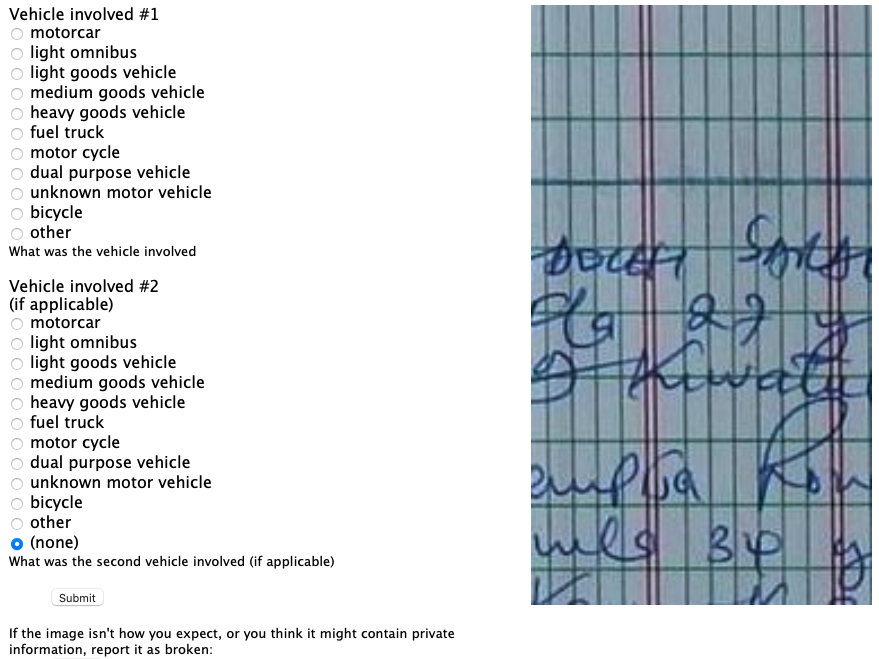
Figure:
It seems a great challenge to automate all the different aspects of the process of data access, but this challenge is underway already through the process of what is commonly called digital transformation. The process of digital transformation takes data away from physical log books and into digital devices. But that transformation process itself comes with challenges. For example, the Kampala police force is not currently equipped to store this data in purely digital form. It would require not only devices (which many officers will have access to) but a system of backup and storage that is beyond the capabilities of many organisations.
Legal complications around data are still a major barrier though. In the EU and the US database schema and indices are subject to copyright law. Companies making data available often require license fees. As many data sources are combined, the composite effect of the different license agreements often makes the legal challenges insurmountable. This was a common challenge in the pandemic, where academics who were capable of dealing with complex data predictions were excluded from data access due to challenges around licensing. A nice counter example was the work led by Nuria Oliver in Spain who after a call to arms in a national newspaper (Oliver (2020)) was able to bring the ecosystem together around mobility data.
However, even when organisation is fully digital, and license issues are overcome, there are issues around how the data is managed stored, accessed. The discoverability of the data and the recording of its provenance are too often neglected in the process of digtial transformation. Further, once an organisation has gone through digital transformation, they begin making predictions around the data. These predictions are data themselves, and their presence in the data ecosystem needs recording. Automating this portion requires structured thinking around our data ecosystems.
Assess
Once the data is accessible, it can be imported (via APIs or database calls or reading a CSV) into the machine and work can be done understanding the nature of the data. The important thing to say about the assess stage is that it only includes things you can do without the question in mind. This runs counter to many ideas about how we do data analytics. The history of statistics was that we think of the question before we collect data. But that was because data was expensive, and it needed to be excplicitly collected. The same mantra is true today of surveillance data. But the new challenge is around happenstance data, data that is cheaply available but may be of poor quality. The nature of the data needs to be understood before its integrated into analysis. Unfortunately, because the work is conflated with other stages, decisions are sometimes made during assessment (for example approaches to imputing missing values) which may be useful in one context, but are useless in others. So the aim in assess is to only do work that is repeatable, and make that work available to others who may also want to use the data.
Case Study: Text Mining for Misinformation
We consider a case study from Joyce Nabende, Head of the Makerere AI Lab. This case study is based on a presentation given by Joyce to the DSA Research Grants, “Project Progress” session on 20th August 2021.
The aim of the case study is to map some of the approaches used by Joyce onto the Access, Assess, Address paradigm.
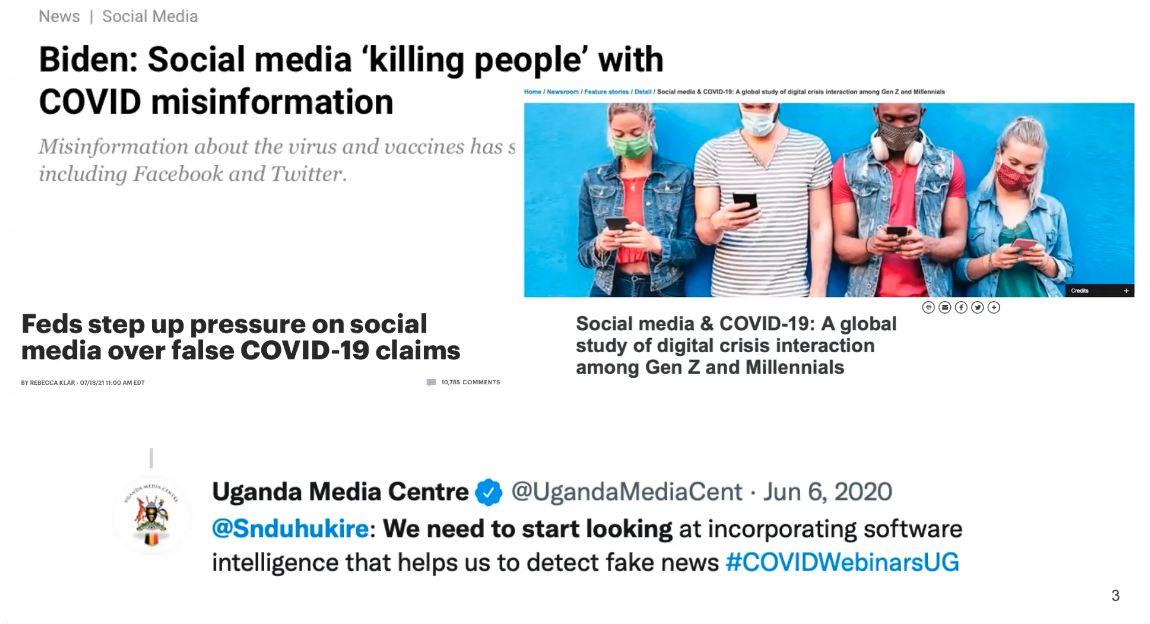
The aim of the project is to develop tools for automated misinformation detection. Web, mobile based social media platforms. Social media posts are invalid, inaccurate, potentially harmful. This is set within the context of the Covid-19 pandemic within Uganda.
In common with many applications of data science, and in line with traditional statistics, the question here comes first, at the beginning of the data collection. But the access of the data is made easier by the fact that the data exists in the digital space already. There are APIs for collecting data from Facebook and Twitter.
The focus here will be trying to understand which parts of this data collection process might be reusable for others. The aim is to separate those reusable parts from aspects that are specific to the question.
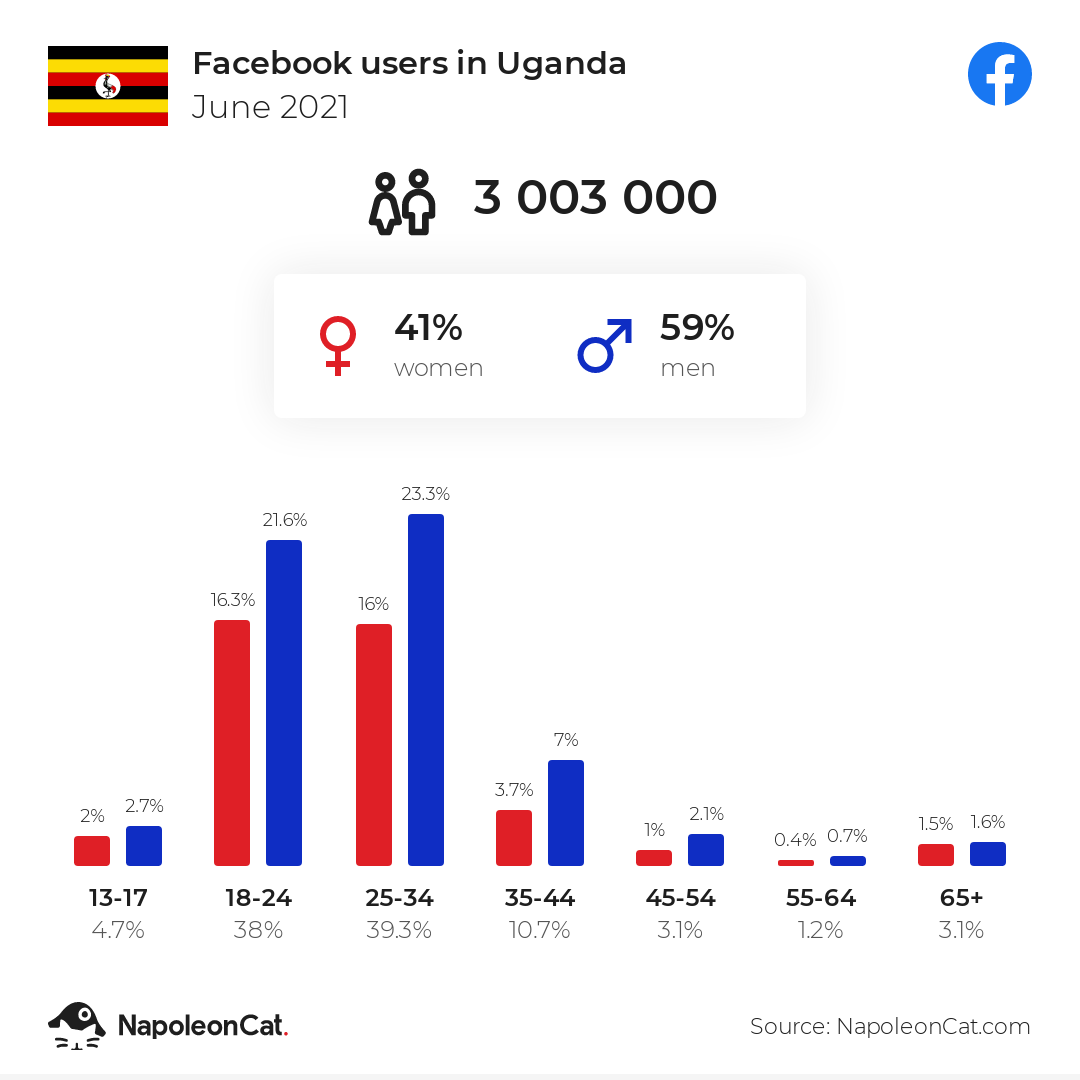
As with any data science problem, it’s vital that domain knowledge is included in the analysis of the problem. To set context, we see in Figure how widespread use of social media is in Uganda for different age groups. The total population of Uganda is around 47 million.
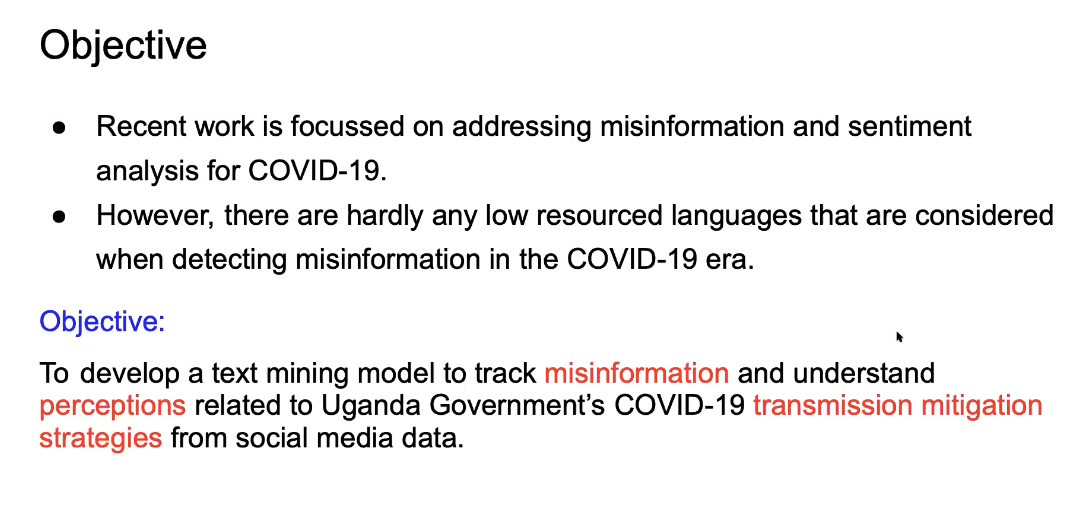
Figure: The objective of the project is to track misinformation and understandperceptions of Ugandan Government’s COVID-19 transmission mitigation strategies.
One particular challenge for this project is dealing with a data set with multiple languages. In Uganda, people don’t just communicate in English, but they will code-switch or communicate purely in, e.g. Luganda. Tools and resources for dealing with code-switching or the Lugandan language in NLP are much less common than tools for dealing with high resource languages (e.g. German, English, French, Spanish, Mandarin). See Magueresse et al. (2020) for a review of NLP in low resource languages, multilingual data sets bring their own problems Aman Ullah et al. (2020).
The Luganda language is the most widely spoken indigenous language in Uganda with more than seven million speakers. By definition, a low resourced language has less capabilities for data annotation and augmentation, e.g. part of speech taggers.
Data Access
The social media data was collected from a set of pages (media institutions, ministry of health, media personalities, top twitter/facebook users from Uganda. All data was then filtered using keywords, ‘ssenyiga,’ ‘kolona,’ ‘corona’ ,‘virus’ ,‘obulwadde,’ ‘corona,’ ‘covid,’ ‘abalwadde,’ ‘ekirwadde,’ ‘akawuka,’ ‘staysafeug,’ ‘stayhome,’ ‘tonsemberera,’ ‘tokwatakudereva,’ ‘vaccine’ to select with Covid-19 related tweets. Very short Facebook posts were also removed. Data was collected in two phases, from March 2020 - March 2021 and then from June 2021 - August 2021. Raw data points 15,354 posts from twitter and 430,075 from Facebook.
Note that in this case, knowledge of the question has been used in accessing the data. The context of the data is Uganda and the focus is Covid-19. That focus is driven by the pandemic. However, as we see when we get to data assessment, there is still an amount of reusable work that could/should be automated.
Data Assessment
After collecting data, the initial assessment was formed to understand the data, uncover patterns and gain insights. Here various visualisations can be used to find any unexpected factors in the data.
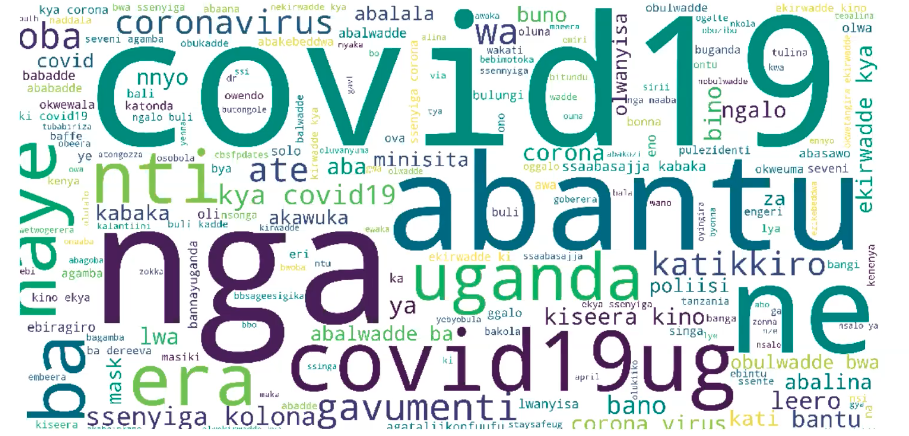
Figure: Word cloud from the Twitter data collected through the filtering.
In the case of the Uganda data set, Joyce found that mixed in with the Covid-19 data were topics focussed on popular Ugandan TV shows and the Ugandan election.
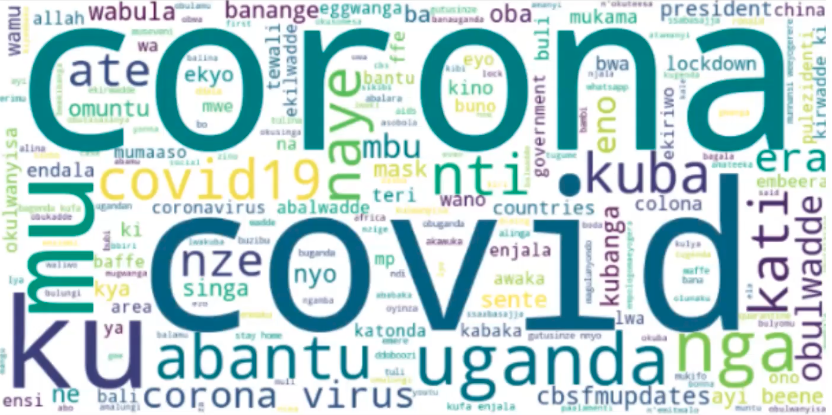
Figure: Word cloud from the Facebook data collected through the filtering.
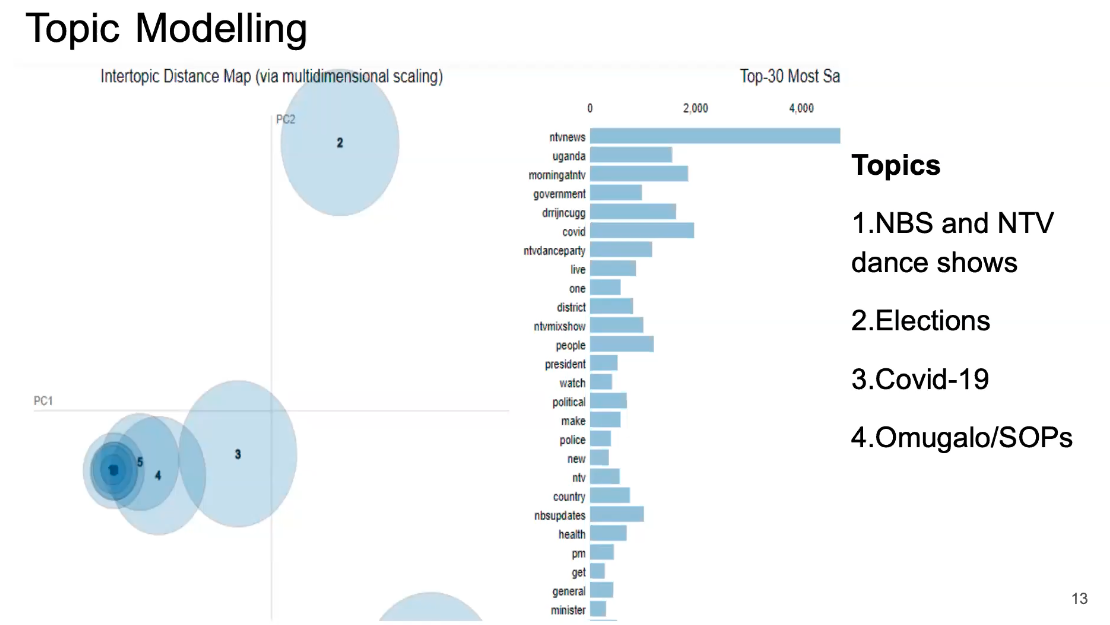
Figure: LDA topics and topic distance maps. Interspersed with the Covid-19 topics are topics associated with television dance shows, elections, and the president showing the importance of having domain knowledge.
Topic modeling highlights the different subjects present in the data, and how they interrelate.
Annotation carried out by seven annotators who could understand both English and Luganda. The data was labeled with the Doccano text annotation tool. Annotations included the data source, the language, the label, the sentiment and the misinformation status.
{Quality assurance performed by reviewing data with an independent team for ensuring annotation guidelines were followed.
Table: Portion of data that was annoted.
| Twitter Data | Facebook Data | |
|---|---|---|
| Initial dataset | 15,354 | 430,075 |
| Dataset after Annotation | 3,527 | 4,479 |
Cohen’s kappa inter-annotation used to measure annotator agreement.
Table: Cohen’s kappa agreement scores for the data.
| Language | 0.89 |
|---|---|
| Aspect | 0.69 |
| Sentiment | 0.73 |
| Misinformation | 0.74 |

Figure: Example of data annotation for sentiment and misinformation from the data set.
The idea of the analysis is to bring this information together for sentiment and misinformation analysis in a dashboard for Covid-19 in Uganda.
Automating Assess
There are lots of interesting projects around automating the assessment of the data, for example one can consider automation of schema and data type detection (Valera and Ghahramani (2017)) or the AI for Data Analytics Project (see Nazábal et al. (2020) for an overview of issues and case studies and the video in Figure for details on the project). We may even view projects like the automatic statistician as automating of assessment (James Robert Lloyd and Ghahramani. (2014)), although arguably one could suggest that the choice of data set used in those projects itself is reflective of the question or context. This highlights the difficulty in separating the stages. The key quesiton to ask in any given context is whether the augmentation you are performing for the data set is going to be helpful or a hindrance to those that may wish to reuse your data.
Figure: The AI for Data Analytics project is an attempt to automate some of the challenges of automated data assessment.
Address
The final stage of the process is to address the question. We’ll spend the least time on this stage here, because it’s the one that is most widely formally taught and the one that most researchers are familiar with. In statistics, this might involve some confirmatory data analysis. In machine learning it may involve designing a predictive model. In many domains it will involve figuring out how best to visualise the data to present it to those who need to make the decisions. That could involve a dashboard, a plot or even summarisation in an Excel spreadsheet.
Automating Address
Perhaps the most widespread approach to automating the address stage is known as AutoML (see video in Figure ). This is an automatic approach to creating ML prediction models. The automatic statistician we mentioned in assess also has some of these goals in mind for automating confirmatory data analysis. But there are clearly other aspects we may wish to automate, particularly around visualization.
Figure: Here Frank Hutter gives a tutorial on AutoML, one of the approaches to automating address.
Conclusions
The particular circumstances of the Covid-19 pandemic have highlighted the challenges of integrating scientific ideas to answer policy questions. In this talk, we’ve given a formal introduction to the problem, the difficulty of communicating between individuals (particularly from different domains) and reviewed the ideas and solutions we used in the Delve initiative.
Recommendations from the DELVE Data report suggest that more effort needs to be placed into working in this manner in normal circumstances, so that when an emergency occurs we are better prepared to deal with the questions we face.
Stepping back from these recommendations, we’ve introduced the “Access, Assess, Address” three stage framework for the data science process. Access is about getting hold of the data, bringing it into the digital machines. Assess is about reusable work we can do on the data before we pose a question about the data. For example, data schema, characterising the missing values, looking for corrupted entries, ensuring that the number of data hasn’t saturated the excel row limit or that a gene name hasn’t been converted to a date. Finally, the address stage is about addressing the statistical question or machine learning prediction we require from the data.
When it comes to the automation process, we can see three areas where we need progress. Access to data itself often requires manual intervention. Even downloading a CSV file may require a password. Building eacosystems of data exchange is vital for automating this step. For assessment we already have work from e.g. the AIDA team at the Alan Turing Institute, automated type detection, the automatic statistician @Valera and Ghahramani (2017);James Robert Lloyd and Ghahramani. (2014) then finally we have AutoML.
Thanks!
For more information on these subjects and more you might want to check the following resources.
- twitter: @lawrennd
- podcast: The Talking Machines
- newspaper: Guardian Profile Page
- blog: http://inverseprobability.com