The Atomic Human: AI, Institutions and Corporate Strategy
Abstract
Artificial intelligence is reshaping the corporate landscape at a pace that outstrips most strategic frameworks. But to navigate this transformation wisely, leaders need to understand what AI actually is — and what it is not. Drawing on The Atomic Human, this lecture explores the fundamental differences between human and machine intelligence through the lens of information bandwidth, and what this means for how institutions process information, make decisions, and change.
We examine how the attention economy constrains organisational design, why the structure of institutions reflects their communication channels, and what happens when automated systems are trusted beyond the limits of their competence. The lecture closes by connecting these ideas to corporate strategy: understanding AI as a megatrend that reshapes competitive advantage, the scope of the firm, and the human resources that cannot be replaced.
Part 1: What AI Is and Isn’t
Henry Ford’s Faster Horse


Figure: A 1925 Ford Model T built at Henry Ford’s Highland Park Plant in Dearborn, Michigan. This example now resides in Australia, owned by the founder of FordModelT.net. From https://commons.wikimedia.org/wiki/File:1925_Ford_Model_T_touring.jpg
It’s said that Henry Ford’s customers wanted a “a faster horse.” If Henry Ford was selling us artificial intelligence today, what would the customer call for, “a smarter human?” That’s certainly the picture of machine intelligence we find in science fiction narratives, but the reality of what we’ve developed is much more mundane.
Car engines produce prodigious power from petrol. Machine intelligences deliver decisions derived from data. In both cases the scale of consumption enables a speed of operation that is far beyond the capabilities of their natural counterparts. Unfettered energy consumption has consequences in the form of climate change. Does unbridled data consumption also have consequences for us?
If we devolve decision making to machines, we depend on those machines to accommodate our needs. If we don’t understand how those machines operate, we lose control over our destiny. Our mistake has been to see machine intelligence as a reflection of our intelligence. We cannot understand the smarter human without understanding the human. To understand the machine, we need to better understand ourselves.
Artificial General Vehicle

Figure: The notion of artificial general intelligence is as absurd as the notion of an artificial general vehicle - no single vehicle is optimal for every journey. (Illustration by Dan Andrews inspired by a conversation about “The Atomic Human” Lawrence (2024))
This illustration was created by Dan Andrews inspired by a conversation about “The Atomic Human” book. The drawing emerged from discussions with Dan about the flawed concept of artificial general intelligence and how it parallels the absurd idea of a single vehicle optimal for all journeys. The vehicle itself is inspired by shared memories of Professor Pat Pending in Hanna Barbera’s Wacky Races.
The Atomic Human
Figure: The Atomic Eye, by slicing away aspects of the human that we used to believe to be unique to us, but are now the preserve of the machine, we learn something about what it means to be human.
The development of what some are calling intelligence in machines, raises questions around what machine intelligence means for our intelligence. The idea of the atomic human is derived from Democritus’s atomism.
In the fifth century bce the Greek philosopher Democritus posed a question about our physical universe. He imagined cutting physical matter into pieces in a repeated process: cutting a piece, then taking one of the cut pieces and cutting it again so that each time it becomes smaller and smaller. Democritus believed this process had to stop somewhere, that we would be left with an indivisible piece. The Greek word for indivisible is atom, and so this theory was called atomism.
The Atomic Human considers the same question, but in a different domain, asking: As the machine slices away portions of human capabilities, are we left with a kernel of humanity, an indivisible piece that can no longer be divided into parts? Or does the human disappear altogether? If we are left with something, then that uncuttable piece, a form of atomic human, would tell us something about our human spirit.
See Lawrence (2024) atomic human, the p. 13.
Information and Embodiment
Figure: Claude Shannon (1916-2001)
| bits/min | billions | 2,000 |
|
billion calculations/s |
~100 | a billion |
| embodiment | 20 minutes | 5 billion years |
Figure: Embodiment factors are the ratio between our ability to compute and our ability to communicate. Relative to the machine we are also locked in. In the table we represent embodiment as the length of time it would take to communicate one second’s worth of computation. For computers it is a matter of minutes, but for a human, it is a matter of thousands of millions of years.
Embodiment Factors: Walking vs Light Speed
Imagine human communication as moving at walking pace. The average person speaks about 160 words per minute, which is roughly 2000 bits per minute. If we compare this to walking speed, roughly 1 m/s we can think of this as the speed at which our thoughts can be shared with others.
Compare this to machines. When computers communicate, their bandwidth is 600 billion bits per minute. Three hundred million times faster than humans or the equiavalent of \(3 \times 10 ^{8}\). In twenty minutes we could be a kilometer down the road, where as the computer can go to the Sun and back again..
This difference is not just only about speed of communication, but about embodiment. Our intelligence is locked in by our biology: our brains may process information rapidly, but our ability to share those thoughts is limited to the slow pace of speech or writing. Machines, in comparison, seem able to communicate their computations almost instantaneously, anywhere.
So, the embodiment factor is the ratio between the time it takes to think a thought and the time it takes to communicate it. For us, it’s like walking; for machines, it’s like moving at light speed. This difference means that most direct comparisons between human and machine need to be carefully made. Because for humans not the size of our communication bandwidth that counts, but it’s how we overcome that limitation..
Figure: Conversation relies on internal models of other individuals.
Figure: Misunderstanding of context and who we are talking to leads to arguments.
Embodiment factors imply that, in our communication between humans, what is not said is, perhaps, more important than what is said. To communicate with each other we need to have a model of who each of us are.
To aid this, in society, we are required to perform roles. Whether as a parent, a teacher, an employee or a boss. Each of these roles requires that we conform to certain standards of behaviour to facilitate communication between ourselves.
Control of self is vitally important to these communications.
The consequences between this mismatch of power and delivery are to be seen all around us. Because, just as driving an F1 car with bicycle wheels would be a fine art, so is the process of communication between humans.
If I have a thought and I wish to communicate it, I first need to have a model of what you think. I should think before I speak. When I speak, you may react. You have a model of who I am and what I was trying to say, and why I chose to say what I said. Now we begin this dance, where we are each trying to better understand each other and what we are saying. When it works, it is beautiful, but when mis-deployed, just like a badly driven F1 car, there is a horrible crash, an argument.
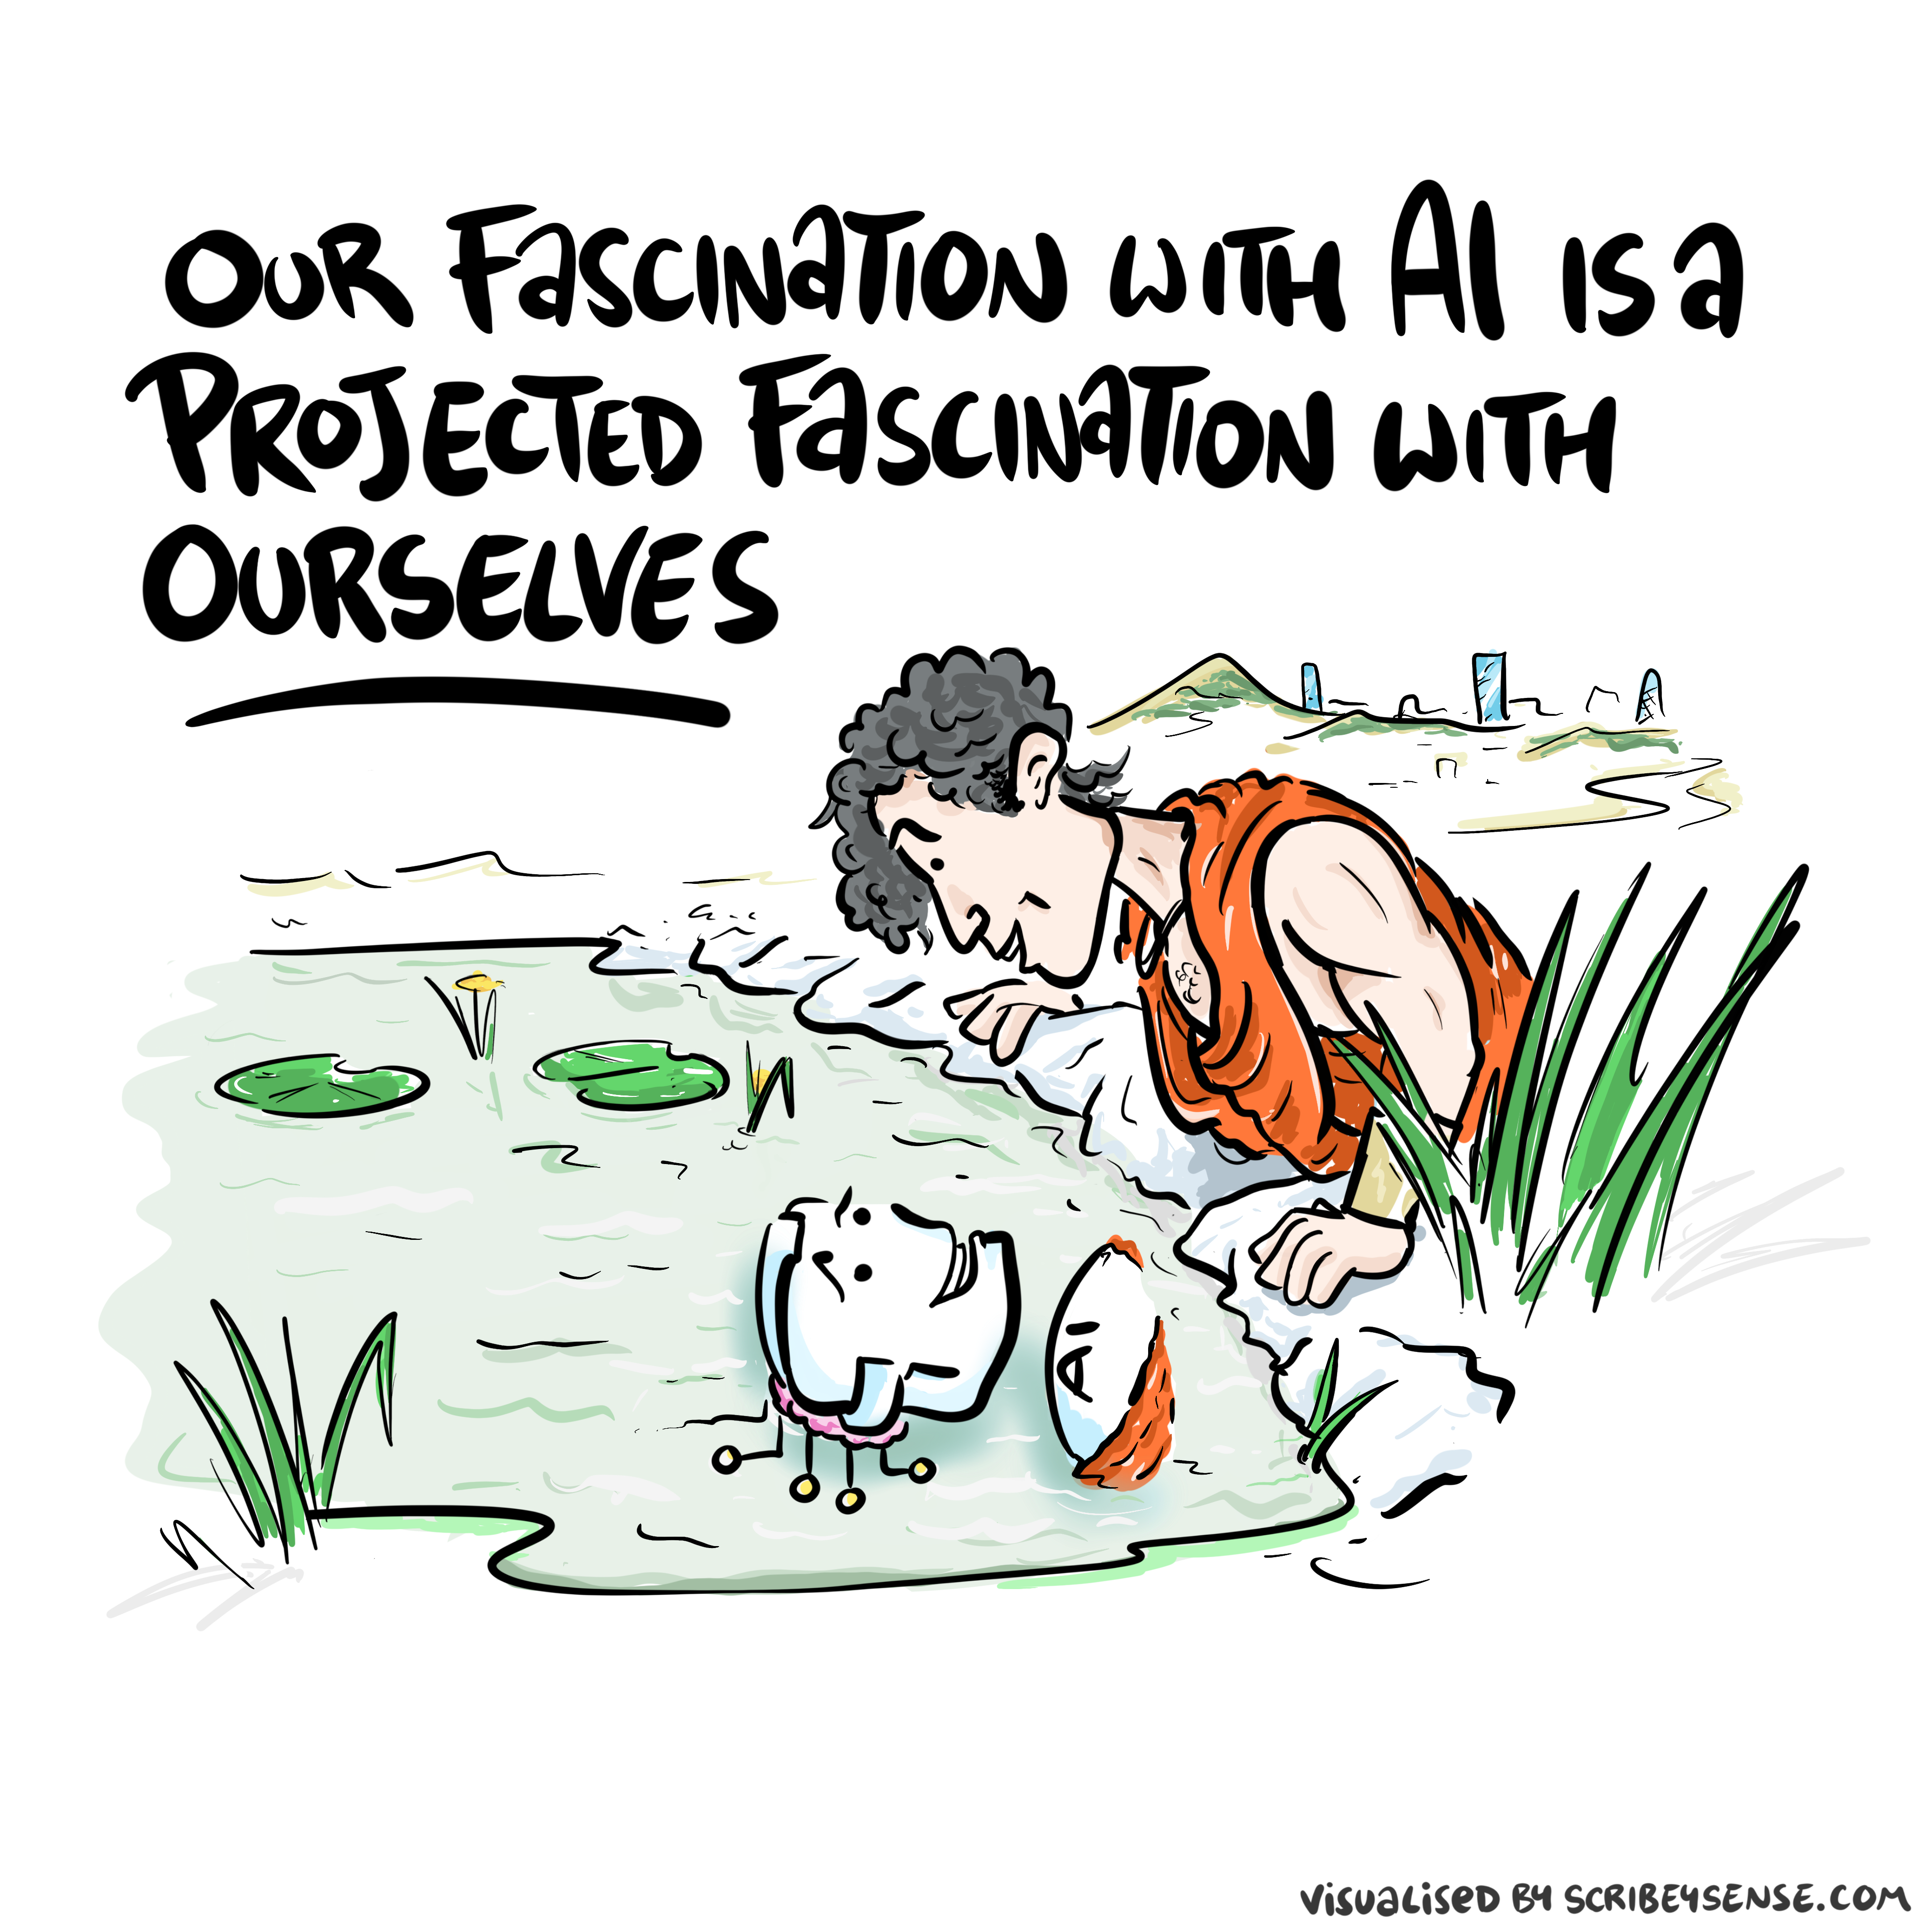
Figure: This is the drawing Dan was inspired to create for Chapter 1. It captures the fundamentally narcissistic nature of our (societal) obsession with our intelligence.
See blog post on Dan Andrews image of our reflective obsession with AI.. See also (Vallor, 2024).
A Six Word Novel

Figure: Consider the six-word novel, apocryphally credited to Ernest Hemingway, “For sale: baby shoes, never worn.” To understand what that means to a human, you need a great deal of additional context. Context that is not directly accessible to a machine that has not got both the evolved and contextual understanding of our own condition to realize both the implication of the advert and what that implication means emotionally to the previous owner.
See Lawrence (2024) baby shoes p. 368.
But this is a very different kind of intelligence than ours. A computer cannot understand the depth of the Ernest Hemingway’s apocryphal six-word novel: “For Sale, Baby Shoes, Never worn,” because it isn’t equipped with that ability to model the complexity of humanity that underlies that statement.
Homo Atomicus
We won’t find the atomic human in the percentage of A grades that our children are achieving at schools or the length of waiting lists we have in our hospitals. It sits behind all this. We see the atomic human in the way a nurse spends an extra few minutes ensuring a patient is comfortable or a bus driver pauses to allow a pensioner to cross the road or a teacher praises a struggling student to build their confidence.
We need to move away from homo economicus towards homo atomicus.
Discussion
Part 2: Information, Institutions and Change
Philosopher’s Stone

Figure: The Alchemist by Joseph Wright of Derby (1771). The picture depicts Hennig Brand discovering the element phosphorus when searching for the Philosopher’s Stone.
The philosopher’s stone is a mythical substance that can convert base metals to gold.
The Attention Economy
Human intelligence is locked-in. It’s bandwidth restricted. This makes it a bottleneck in the attention economy.
Herbert Simon on Information
What information consumes is rather obvious: it consumes the attention of its recipients. Hence a wealth of information creates a poverty of attention …
Simon (1971)
The attention economy was a phenomenon described in 1971 by the American computer scientist Herbert Simon. He saw the coming information revolution and wrote that a wealth of information would create a poverty of attention. Too much information means that human attention becomes the scarce resource, the bottleneck. It becomes the gold in the attention economy.
The power associated with control of information dates back to the invention of writing. By pressing reeds into clay tablets Sumerian scribes stored information and controlled the flow of information.
New Flow of Information
Classically the field of statistics focused on mediating the relationship between the machine and the human. Our limited bandwidth of communication means we tend to over-interpret the limited information that we are given, in the extreme we assign motives and desires to inanimate objects (a process known as anthropomorphizing). Much of mathematical statistics was developed to help temper this tendency and understand when we are valid in drawing conclusions from data.
Figure: The trinity of human, data, and computer, and highlights the modern phenomenon. The communication channel between computer and data now has an extremely high bandwidth. The channel between human and computer and the channel between data and human is narrow. New direction of information flow, information is reaching us mediated by the computer. The focus on classical statistics reflected the importance of the direct communication between human and data. The modern challenges of data science emerge when that relationship is being mediated by the machine.
Data science brings new challenges. In particular, there is a very large bandwidth connection between the machine and data. This means that our relationship with data is now commonly being mediated by the machine. Whether this is in the acquisition of new data, which now happens by happenstance rather than with purpose, or the interpretation of that data where we are increasingly relying on machines to summarize what the data contains. This is leading to the emerging field of data science, which must not only deal with the same challenges that mathematical statistics faced in tempering our tendency to over interpret data but must also deal with the possibility that the machine has either inadvertently or maliciously misrepresented the underlying data.
See Lawrence (2024) topography, information p. 34-9, 43-8, 57, 62, 104, 115-16, 127, 140, 192, 196, 199, 291, 334, 354-5. See Lawrence (2024) anthropomorphization (‘anthrox’) p. 30-31, 90-91, 93-4, 100, 132, 148, 153, 163, 216-17, 239, 276, 326, 342.
Institutional Character
Before we start, I’d like to highlight one idea that will be key for contextualisation of everything else. There is a strong interaction between the structure of an organisation and the structure of its software.
This is known as Conway’s law:
Organizations, who design systems, are constrained to produce designs which are copies of the communication structures of these organizations.
Melvin Conway Conway (n.d.)
The API Mandate
The API Mandate was a memo issued by Jeff Bezos in 2002. Internet folklore has the memo making five statements:
- All teams will henceforth expose their data and functionality through service interfaces.
- Teams must communicate with each other through these interfaces.
- There will be no other form of inter-process communication allowed: no direct linking, no direct reads of another team’s data store, no shared-memory model, no back-doors whatsoever. The only communication allowed is via service interface calls over the network.
- It doesn’t matter what technology they use.
- All service interfaces, without exception, must be designed from the ground up to be externalizable. That is to say, the team must plan and design to be able to expose the interface to developers in the outside world. No exceptions.
The mandate marked a shift in the way Amazon viewed software, moving to a model that dominates the way software is built today, so-called “Software-as-a-Service.”
Any organization that designs a system (defined broadly) will produce a design whose structure is a copy of the organization’s communication structure.
Conway (n.d.)
The law is cited in the classic software engineering text, The Mythical Man Month (Brooks, n.d.).
As a result, and in awareness of Conway’s law, the implementation of this mandate also had a dramatic effect on Amazon’s organizational structure.
Because the design that occurs first is almost never the best possible, the prevailing system concept may need to change. Therefore, flexibility of organization is important to effective design.
Conway (n.d.)
Amazon is set up around the notion of the “two pizza team.” Teams of 6-10 people that can be theoretically fed by two (American) pizzas. This structure is tightly interconnected with the software. Each of these teams owns one of these “services.” Amazon is strict about the team that develops the service owning the service in production. This approach is the secret to their scale as a company, and the approach has been adopted by many other large tech companies. The software-as-a-service approach changed the information infrastructure of the company. The routes through which information is shared. This had a knock-on effect on the corporate culture.
Amazon works through an approach I think of as “devolved autonomy.” The culture of the company is widely taught (e.g. Customer Obsession, Ownership, Frugality), a team’s inputs and outputs are strictly defined, but within those parameters, teams have a great of autonomy in how they operate. The information infrastructure was devolved, so the autonomy was devolved. The different parts of Amazon are then bound together through shared corporate culture.
Amazon prides itself on agility, I spent three years there and I can confirm things move very quickly. I used to joke that just as a dog year is seven normal years, an Amazon year is four normal years in any other company.
Not all institutions move quickly. My current role is at the University of Cambridge. There are similarities between the way a University operates and the way Amazon operates. In particular Universities exploit devolved autonomy to empower their research leads.
Naturally there are differences too, for example, Universities do less work on developing culture. Corporate culture is a critical element in ensuring that despite the devolved autonomy of Amazon, there is a common vision.
Cambridge University is over 800 years old. Agility is not a word that is commonly used to describe its institutional framework. I don’t want to make a claim for whether an agile institution is better or worse, it’s circumstantial. Institutions have characters, like people. The institutional character of the University is the one of a steady and reliable friend. The institutional character of Amazon is more mecurial.
Why do I emphasise this? Because when it comes to organisational data science, when it comes to a data driven culture around our decision making, that culture inter-plays with the institutional character. If decision making is truly data-driven, then we should expect co-evolution between the information infrastructure and the institutional structures.
A common mistake I’ve seen is to transplant a data culture from one (ostensibly) successful institution to another. Such transplants commonly lead to organisational rejection. The institutional character of the new host will have cultural antibodies that operate against the transplant even if, at some (typically executive) level the institution is aware of the vital need for integrating the data driven culture.
A major part of my job at Amazon was dealing with these tensions. As a scientist, initially working across the company, working with my team introduced dependencies and practices that impinged on the devolved autonomy. I face a similar challenge at Cambridge. Our aim is to integrate data driven methodologies with the classical sciences, humanities and across the academic spectrum. The devolved autonomy inherent in University research provides a similar set of challenges to those I faced at Amazon.
My role before Amazon was at the University of Sheffield. Those were quieter times in terms of societal interest in machine learning and data science, but the Royal Society was already convening a working group on Machine Learning. This was my first interaction with policy advice, I’ve continued that interaction today by working with the AI Council, convening the DELVE group to give pandemic advice, serving on the Advisory Council for the Centre for Science and Policy, and the Advisory Board for the Centre for Data Ethics and Innovation. I’m not an expert on the civil service and government, but I believe many of the themes I’ve outlined above also apply within government. The ideas I’ll talk about today build on the experiences I’ve had at Sheffield, Amazon, and Cambridge alongside the policy work I’ve been involved in to make suggestions of what the barriers are for enabling a culture of data driven policy making.
How Information Flows in Organisations
The information topography of an organisation is how information flows through the organisaiton. At one level this will involve a hierarchy of information propagation: the chart of reporting lines. But alongside this there are other mechanisms to share information.
This dictates the organisations "absorbtive capacity which in turn dictates how it will make decisions. The nature of decisio of decisions depend on how well the information that feeds them can travel.
Classically information propagates through two principle patterns. Hub-and-spoke networks, and peer-to-peer meshes. The hub-and-spoke becomes a hierarchy as it scales. The different mechanisms have different implications for bandwidth, latency, and resilience.
Figure: In a classical corporate hierarchy, information travels vertically. Strategic decisions flow downward from the CEO through the C-suite (CFO, CIO, COO) to functional departments. Data and reports flow upward. External signals from customers and markets enter at the top. Each layer introduces delay and compression.
The hub-and-spoke model centralises information processing. All communication between departments routes through a central function. This works well for “command and control” but the central node tends to become overloaded. In practive that’s why we obtain a hierarchy so each spoke is itself a hub for the next level.
Figure: In a hub-and-spoke model, all information routes through a central node. This can result in low latency (good command and control) but the central hub can become overloaded.
Peer-to-peer structures allow direct communication between teams without a central intermediary. This maximises bandwidth and reduces latency, but requires more communication interfaces than are managed with hub-and-spoke. Amazon’s API mandate — requiring all teams to expose their capabilities through programmatic interfaces — is an example of deliberately engineering a peer-to-peer information structure within a large organisation. The challenge is coordination: without a hub, norms and protocols must emerge from the network itself. This is where culture becomes important
Figure: In a peer-to-peer network, teams communicate directly with each other through adjacent and cross-cutting channels, without routing through a central authority. This structure is resilient and high-bandwidth, but requires shared protocols and trust. It mirrors how open-source software communities and federated data ecosystems operate.
Culture and Communication
Blake’s Newton
William Blake’s rendering of Newton captures humans in a particular state. He is trance-like absorbed in simple geometric shapes. The feel of dreams is enhanced by the underwater location, and the nature of the focus is enhanced because he ignores the complexity of the sea life around him.

Figure: William Blake’s Newton. 1795c-1805
See Lawrence (2024) Blake, William Newton p. 121–123.
The caption in the Tate Britain reads:
Here, Blake satirises the 17th-century mathematician Isaac Newton. Portrayed as a muscular youth, Newton seems to be underwater, sitting on a rock covered with colourful coral and lichen. He crouches over a diagram, measuring it with a compass. Blake believed that Newton’s scientific approach to the world was too reductive. Here he implies Newton is so fixated on his calculations that he is blind to the world around him. This is one of only 12 large colour prints Blake made. He seems to have used an experimental hybrid of printing, drawing, and painting.
From the Tate Britain
See Lawrence (2024) Blake, William Newton p. 121–123, 258, 260, 283, 284, 301, 306.
Sistine Chapel Ceiling
Shortly before I first moved to Cambridge, my girlfriend (now my wife) took me to the Sistine Chapel to show me the recently restored ceiling.

Figure: The ceiling of the Sistine Chapel.
When we got to Cambridge, we both attended Patrick Boyde’s talks on chapel. He focussed on both the structure of the chapel ceiling, describing the impression of height it was intended to give, as well as the significance and positioning of each of the panels and the meaning of the individual figures.
The Creation of Adam

Figure: Photo of Detail of Creation of Man from the Sistine chapel ceiling.
One of the most famous panels is central in the ceiling, it’s the creation of man. Here, God in the guise of a pink-robed bearded man reaches out to a languid Adam.
The representation of God in this form seems typical of the time, because elsewhere in the Vatican Museums there are similar representations.

Figure: Photo detail of God.
Photo from https://commons.wikimedia.org/wiki/File:Michelangelo,_Creation_of_Adam_04.jpg.
My colleague Beth Singler has written about how often this image of creation appears when we talk about AI (Singler, 2020).
See Lawrence (2024) Michelangelo, The Creation of Adam p. 7-9, 31, 91, 105–106, 121, 153, 206, 216, 350.
The way we represent this “other intelligence” in the figure of a Zeus-like bearded mind demonstrates our tendency to embody intelligences in forms that are familiar to us.
Lunette Rehoboam Abijah
Many of Blake’s works are inspired by engravings he saw of the Sistine chapel ceiling. The pose of Newton is taken from the Lunette depiction of Abijah, one of the Michelangeo’s ancestors of Christ.

Figure: Lunette containing Rehoboam and Abijah.
Elohim Creating Adam
Blake’s vision of the creation of man, known as Elohim Creating Adam, is a strong contrast to Michelangelo’s. The faces of both God and Adam show deep anguish. The image is closer to representations of Prometheus receiving his punishment for sharing his knowledge of fire than to the languid ecstasy we see in Michelangelo’s representation.

Figure: William Blake’s Elohim Creating Adam.
The caption in the Tate reads:
Elohim is a Hebrew name for God. This picture illustrates the Book of Genesis: ‘And the Lord God formed man of the dust of the ground.’ Adam is shown growing out of the earth, a piece of which Elohim holds in his left hand.
For Blake the God of the Old Testament was a false god. He believed the Fall of Man took place not in the Garden of Eden, but at the time of creation shown here, when man was dragged from the spiritual realm and made material.
From the Tate Britain
Blake’s vision is demonstrating the frustrations we experience when the (complex) real world doesn’t manifest in the way we’d hoped.
See Lawrence (2024) Blake, William Elohim Creating Adam p. 121, 217–18.
We communicate with each other through shared cultural reference points: stories, rituals, and artefacts. Great artworks are not just decoration: they are compressed cultural objects that can carry meaning across centuries.
The Sistine Chapel becomes a kind of public interface: a shared “model” that people can point at, interpret, dispute, and transmit. In that sense, the artwork itself is part of the communication system.


Figure: The creation of Adam and the Lunette of Abijah come to gether to influence Blake’s version of Newton, yet his view of creation is very different from Michelangelo’s.
What’s striking here is how influence works: a pose moves from a Michelangelo lunette into Blake’s Newton; a creation narrative is reinterpreted as anguish in Elohim Creating Adam. These are “links” in a human communication network.
Human communication is not only words passed between individuals. We also communicate through shared artefacts — images, stories, rituals, institutions — that act as a common reference frame. These artefacts stabilise meaning because they persist, they can be revisited, and they can be interpreted together.
This version of the “human culture interacting” diagram grounds the idea in a concrete chain: the Sistine Chapel as a shared cultural object; Michelangelo’s figures as a visual vocabulary; Blake’s Newton borrowing a pose from a lunette; and Blake’s Elohim Creating Adam reinterpreting the creation narrative. In other words: a human communication network made of artefacts.
Figure: Humans use culture, facts and artefacts to communicate.
More Information Topography
In a market economy, monetary flows are information flows. Information about a product, service, or capability travels peer-to-peer across the network, money follows.
Figure: Information flows peer-to-peer across the network (grey, bidirectional). Money flows directionally from customers through the firm network to markets (gold). The two flows are complementary: information establishes the channel, money follows it.
One natural answer to the coordination problem of peer-to-peer networks is to place training and culture at the centre of the hub-and-spoke. Rather than routing decisions through a headquarters, the hub disseminates shared values, capabilities, and ways of working. The spokes retain autonomy in how they operate, but the centre ensures they speak a common language. This is how high-performing organisations like the SAS, McKinsey, or the Catholic Church have historically scaled without losing coherence.
Figure: When training and culture sit at the hub, the central function does not command — it calibrates. Departments retain operational autonomy while sharing a common language, values, and capability base. Information flows to and from the centre, but the centre’s role is alignment rather than control.
Trust, Autonomy and Embodiment
Trust, Autonomy and Embodiment
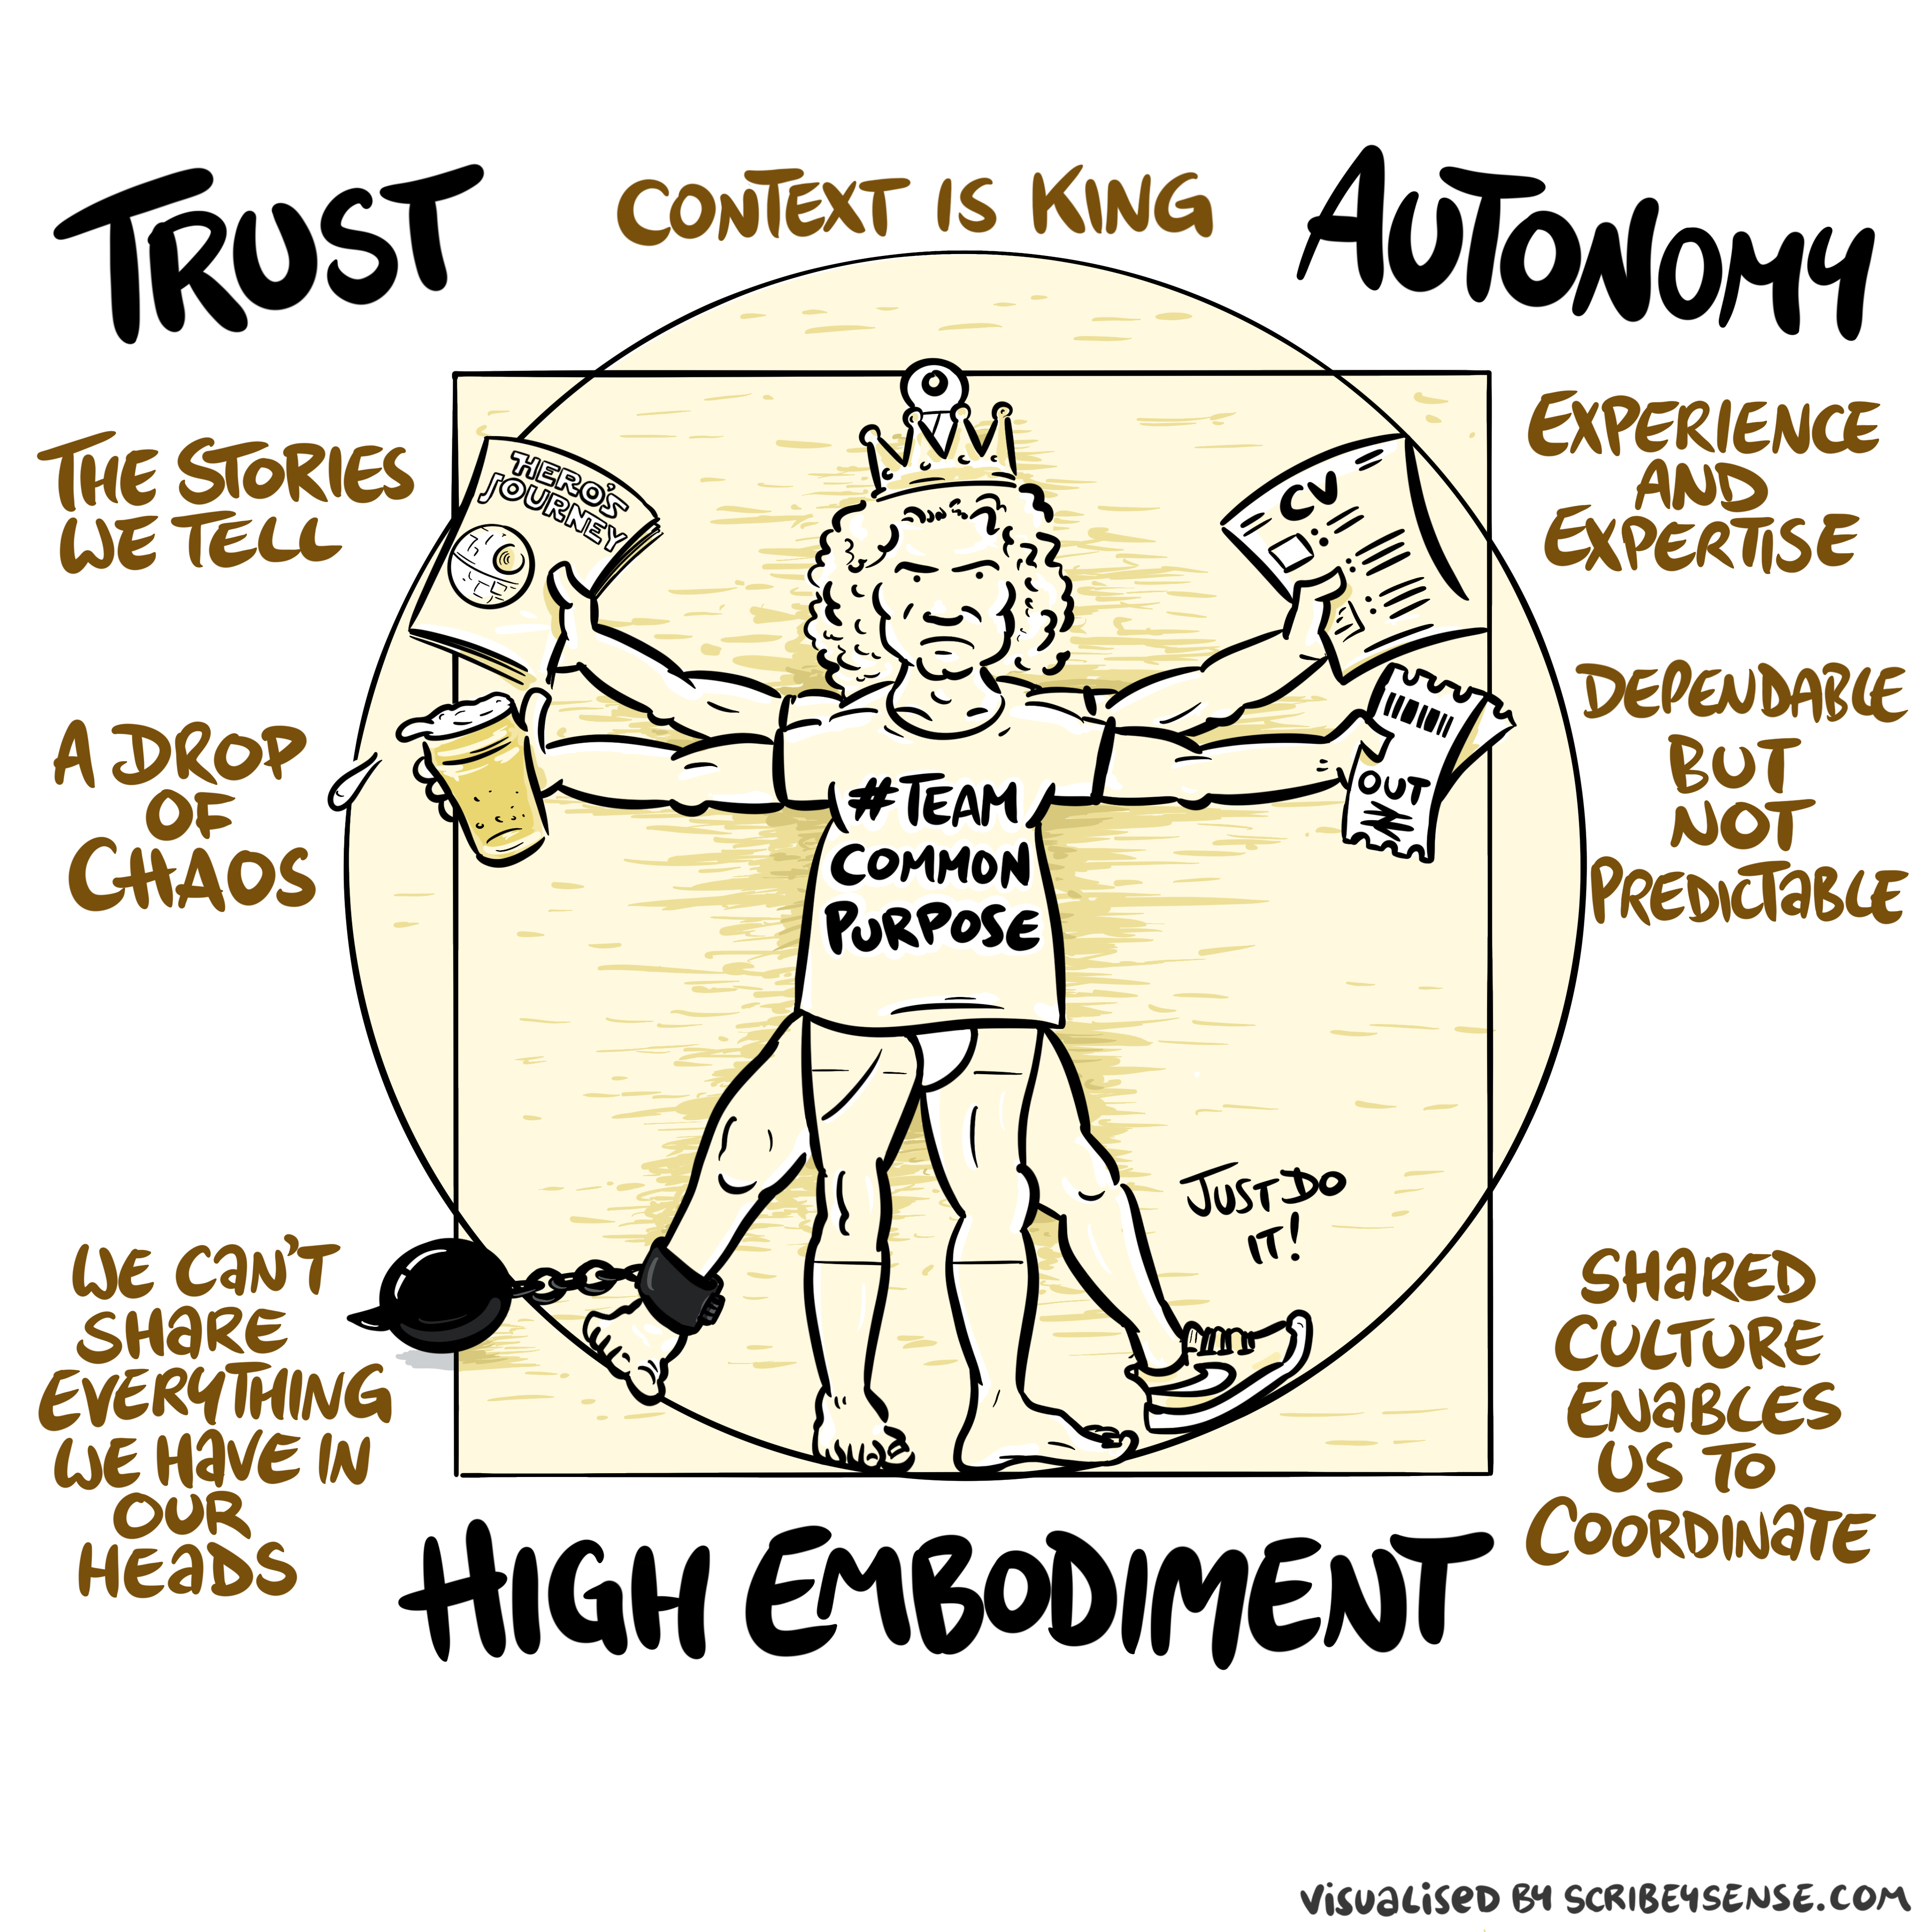
Figure: The relationships between trust, autonomy and embodiment are key to understanding how to properly deploy AI systems in a way that avoids digital autocracy. (Illustration by Dan Andrews inspired by Chapter 3 “Intent” of “The Atomic Human” Lawrence (2024))
This illustration was created by Dan Andrews after reading Chapter 3 “Intent” of “The Atomic Human” book. The chapter explores the concept of intent in AI systems and how trust, autonomy, and embodiment interact to shape our relationship with technology. Dan’s drawing captures these complex relationships and the balance needed for responsible AI deployment.
See blog post on Dan Andrews image from Chapter 3.
Trust is not a slogan; it is the infrastructure that allows autonomy to be devolved without losing control. Autonomy is always conditional: it depends on what information is available, what incentives shape behaviour, and whether escalation and accountability are real. In executive settings, the practical question is: where do we allow delegation (to people or machines), and where do we insist on human judgement and responsibility?
See Lawrence (2024) trust p. 43, 79, 100. See Lawrence (2024) embodiment factor p. 13, 29, 35, 79, 87, 105, 197, 216-217, 249, 269, 327, 353, 363, 369. See Lawrence (2024) topography, information p. 34-9, 43-8, 57, 62, 104, 115-16, 127, 140, 192, 196, 199, 291, 334, 354-5.
See blog post on Dan Andrews image from Chapter 3..
Trust is the connective tissue of institutions. When we deploy AI systems, we are making decisions about where to place trust — in the algorithm, in the human, or in some combination. Getting this balance wrong has consequences that range from lost productivity to serious ethical failures.
A Warning: The Horizon Scandal
The Horizon Scandal
In the UK we saw these effects play out in the Horizon scandal: the accounting system of the national postal service was computerized by Fujitsu and first installed in 1999, but neither the Post Office nor Fujitsu were able to control the system they had deployed. When it went wrong individual sub postmasters were blamed for the systems’ errors. Over the next two decades they were prosecuted and jailed leaving lives ruined in the wake of the machine’s mistakes.

See Lawrence (2024) Horizon scandal p. 371.
Part 3: Strategic Implications
The Productivity Flywheel
Productivity Flywheel
Figure: The productivity flywheel suggests technical innovation is reinvested.
The productivity flywheel should return the gains released by productivity through funding. This relies on the economic value mapping the underlying value.
Attention Reinvestment Cycle
Figure: The attention flywheel focusses on reinvesting human capital.
While the traditional productivity flywheel focuses on reinvesting financial capital, the attention flywheel focuses on reinvesting human capital - our most precious resource in an AI-augmented world. This requires deliberately creating systems that capture the value of freed attention and channel it toward human-centered activities that machines cannot replicate.
Supply Chain of Ideas
Model is “supply chain of ideas” framework, particularly in the context of information technology and AI solutions like machine learning and large language models. You suggest that this idea flow, from creation to application, is similar to how physical goods move through economic supply chains.
In the realm of IT solutions, there’s been an overemphasis on macro-economic “supply-side” stimulation - focusing on creating new technologies and ideas - without enough attention to the micro-economic “demand-side” - understanding and addressing real-world needs and challenges.
Imagining the supply chain rather than just the notion of the Innovation Economy allows the conceptualisation of the gaps between macro and micro economic issues, enabling a different way of thinking about process innovation.
Phrasing things in terms of a supply chain of ideas suggests that innovation requires both characterisation of the demand and the supply of ideas. This leads to four key elements:
- Multiple sources of ideas (diversity)
- Efficient delivery mechanisms
- Quick deployment capabilities
- Customer-driven prioritization
The next priority is mapping the demand for ideas to the supply of ideas. This is where much of our innovation system is failing. In supply chain optimisaiton a large effort is spent on understanding current stock and managing resources to bring the supply to map to the demand. This includes shaping the supply as well as managing it.
The objective is to create a system that can generate, evaluate, and deploy ideas efficiently and effectively, while ensuring that people’s needs and preferences are met. The customer here depends on the context - it could be the public, it could be a business, it could be a government department but very often it’s individual citizens. The loss of their voice in the innovation economy is a trigger for the gap between the innovation supply (at a macro level) and the innovation demand (at a micro level).
Where Should AI Be Directed?
Wicked Problems
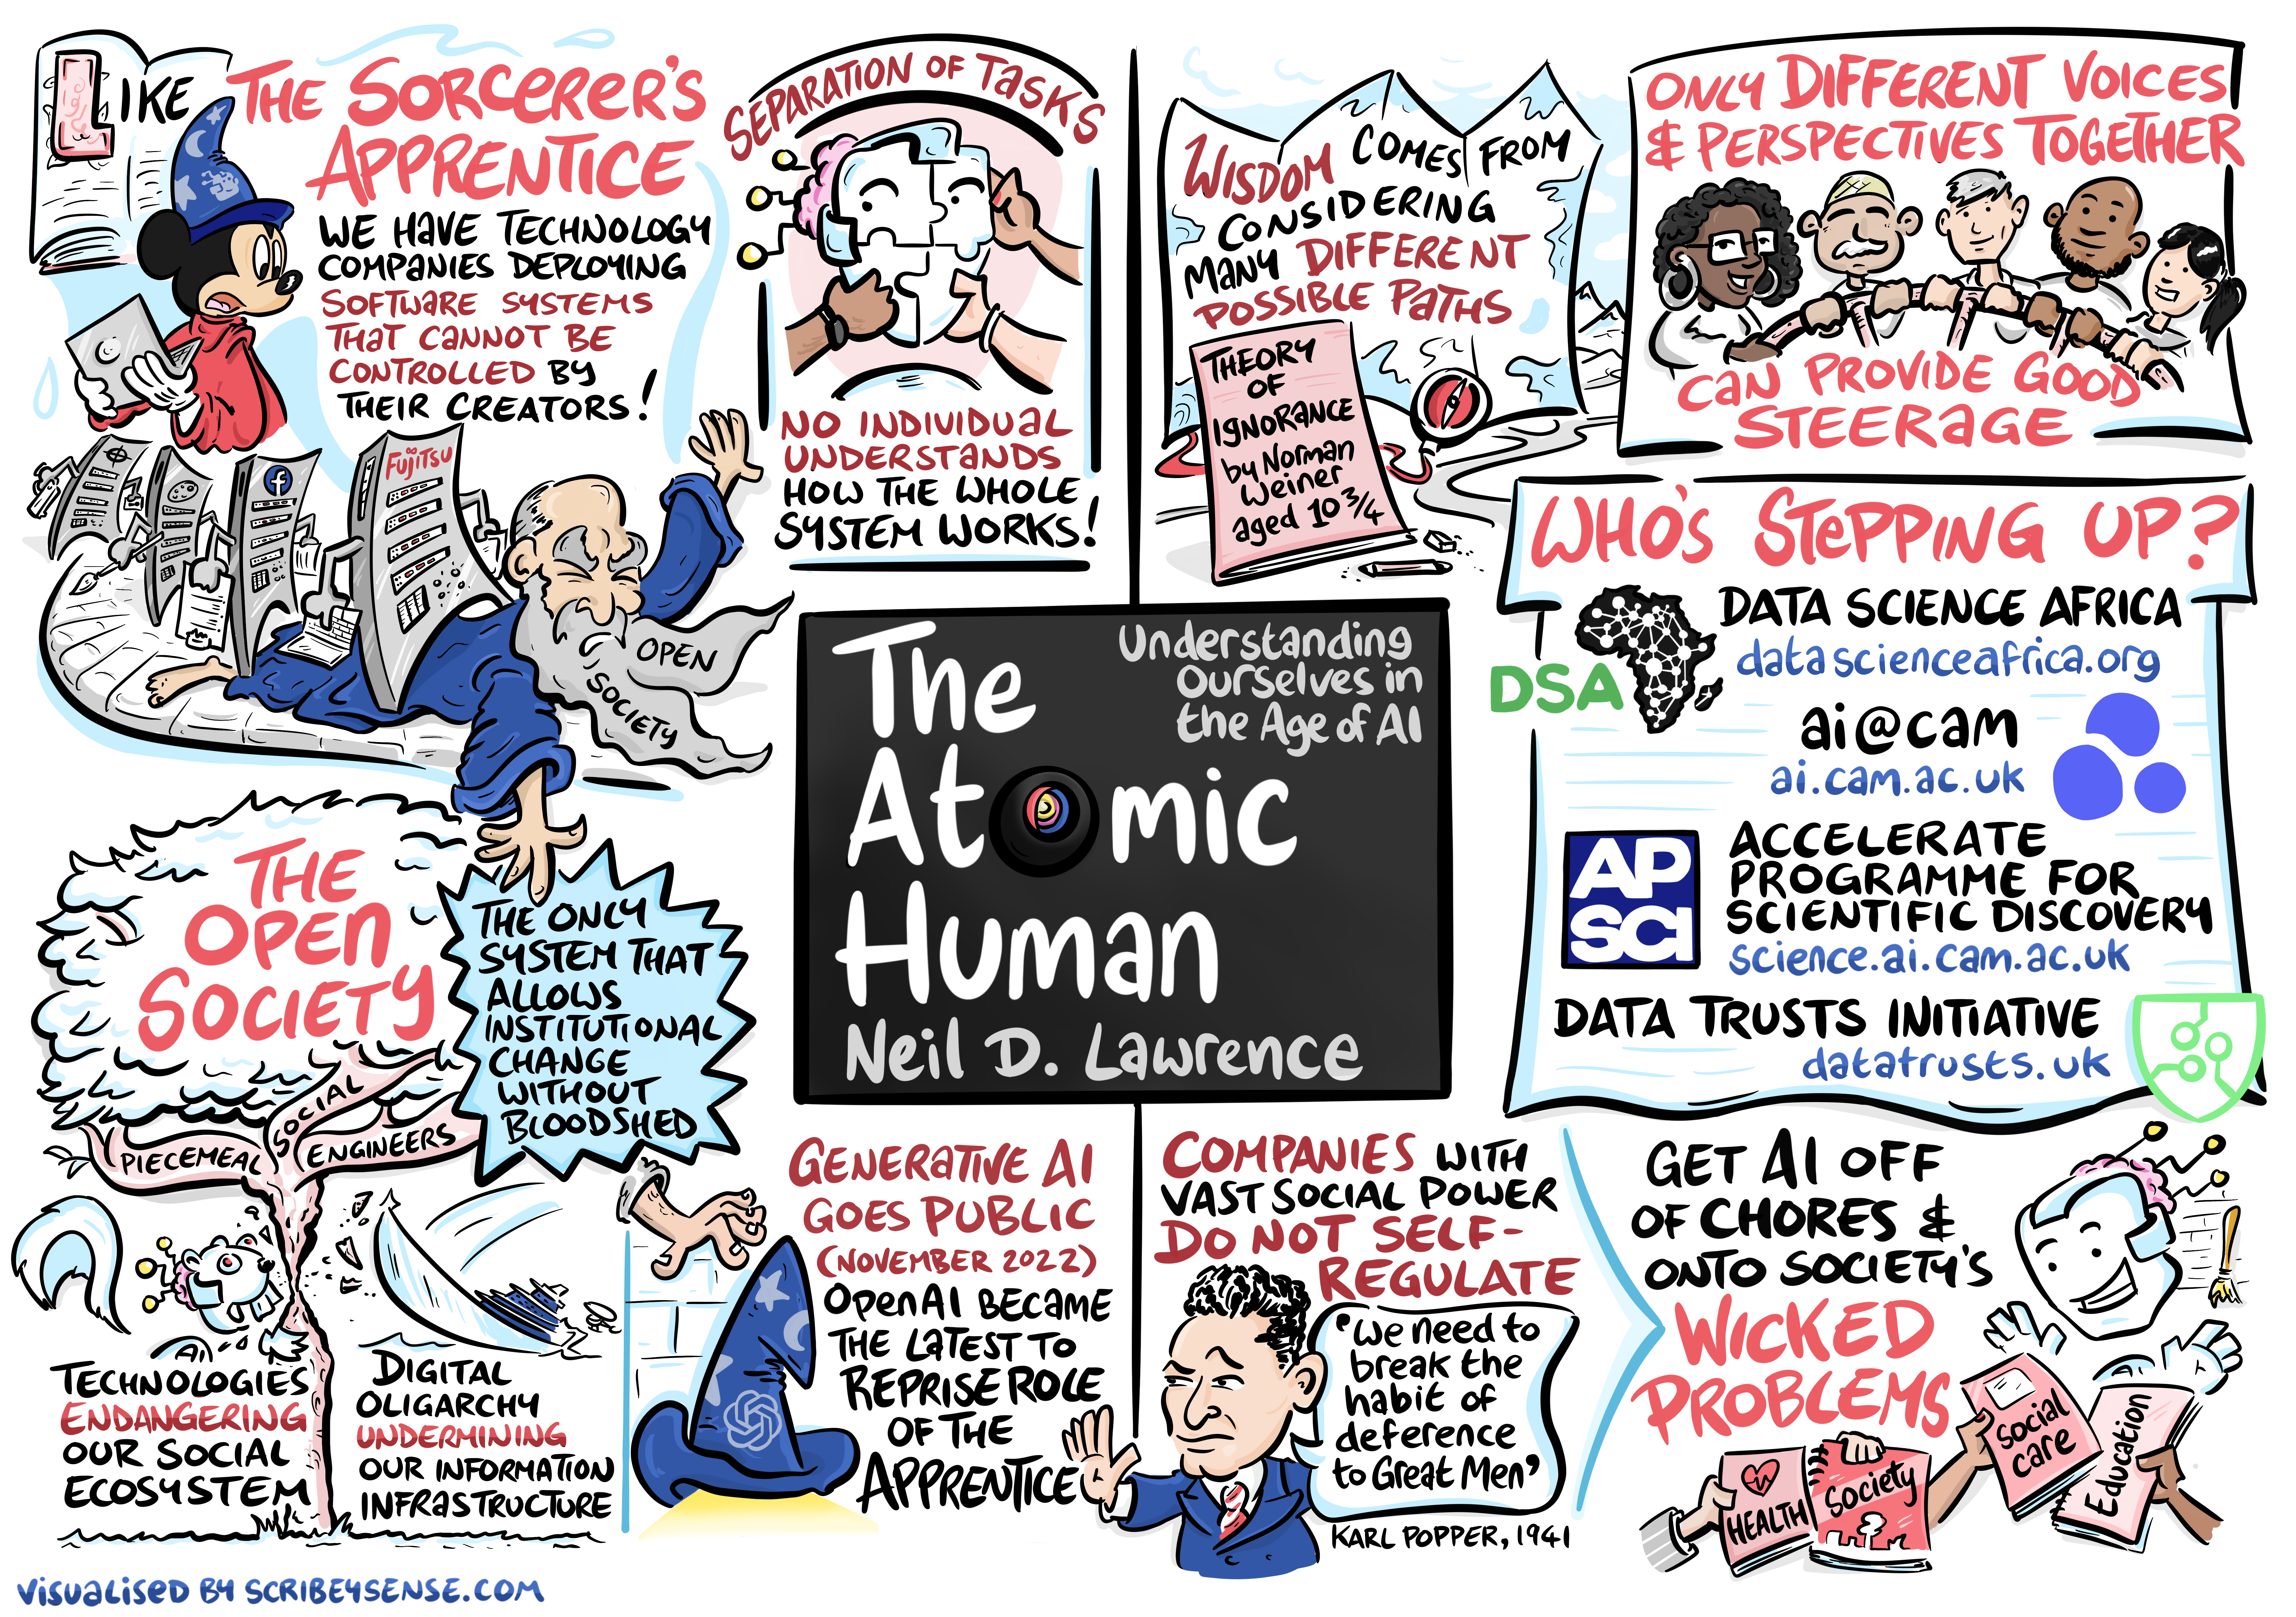
Figure: Society faces many wicked problems in health, education, security, and social care that require carefully deploying AI toward meaningful societal challenges rather than focusing on commercially appealing applications. (Illustration by Dan Andrews inspired by the Epilogue of “The Atomic Human” Lawrence (2024))
This illustration was created by Dan Andrews after reading the Epilogue of “The Atomic Human” book. The Epilogue discusses how we might deploy AI to address society’s most pressing challenges, and Dan’s drawing captures the various wicked problems we face and some of the initiatives that are looking to address them.
See blog post on Who is Stepping Up?.
The closing provocation: AI’s most important strategic role may not be in optimising what firms already do, but in addressing the problems that have been too hard, too expensive, or too complex to solve without it. Society’s wicked problems — in health, education, social care, climate — represent both a moral challenge and a strategic opportunity for organisations prepared to engage with them.
Thanks!
For more information on these subjects and more you might want to check the following resources.
- company: Trent AI
- book: The Atomic Human
- twitter: @lawrennd
- podcast: The Talking Machines
- newspaper: Guardian Profile Page
- blog: http://inverseprobability.com